
Mathematics, 29.03.2020 20:01 gizmokris
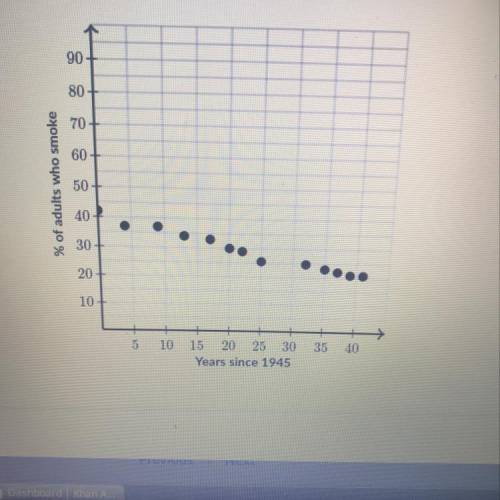
The scatter plot below shows the relationship between the percentage of American adults who smoke and years since 1945.
During this time period, the percentage of adults who smoked changed each year by about
Choose 1 answer
(A) -2 percentage points
(B) -1 percentage points
(C) -1/2 percentage points
(D) -1/4 percentage points

Answers: 3
Another question on Mathematics
Mathematics, 20.06.2019 18:04
Approximately how many more job openings are expected for security guards than pharmacy technicians? a. 2,000 b. 11,100 c. 21,000 d. 32,000
Answers: 1
Mathematics, 21.06.2019 17:30
Subscriptions to a popular fashion magazine have gone down by a consistent percentage each year and can be modeled by the function y = 42,000(0.96)t. what does the value 42,000 represent in the function?
Answers: 2
Mathematics, 21.06.2019 21:30
Two airplanes start at the same place and travel in opposite directions,one at 395 miles per hour and the other at 422 miles per hour. how many hours will it take for the planes to be 2451 miles apart?
Answers: 1
Mathematics, 21.06.2019 23:10
Use the distance formula to find the distance between (-3,5) and (3,1)
Answers: 1
You know the right answer?
The scatter plot below shows the relationship between the percentage of American adults who smoke an...
Questions


English, 10.03.2020 00:02

History, 10.03.2020 00:02
English, 10.03.2020 00:02


