The graph shows the relationship between distance driven and gallons of gas used.
Continuous g...

Mathematics, 02.04.2020 06:49 brittd2728
The graph shows the relationship between distance driven and gallons of gas used.
Continuous graph on a coordinate plane shows distance driven, numbered 20 to 60 along the horizontal axis, and gallons of gas used, numbered 1 to 4 on the vertical axis. Solid circles appear at points (0, 0), (30, 1), (60, 2).
Use the graph to complete the statements.
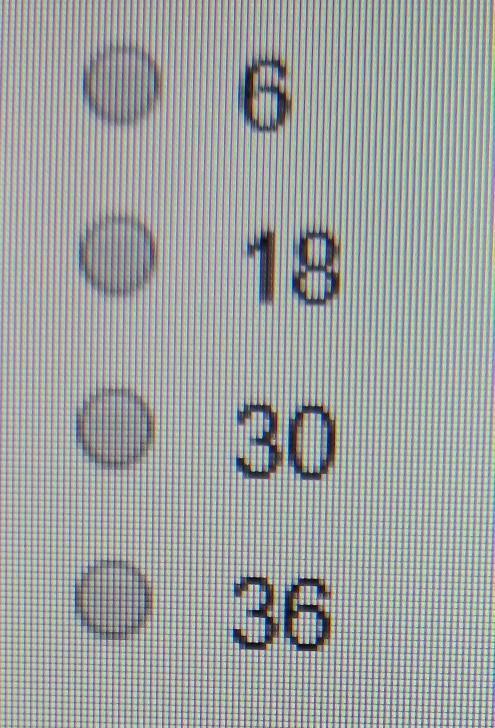
The car gets miles to the gallon.
After the car has traveled miles, 2 and two-thirdsgallons of gas have been consumed.

Answers: 1
Another question on Mathematics

Mathematics, 21.06.2019 20:50
Including 6% sales tax, an inn charges $135.68 per night. find the inns nightly cost
Answers: 1

Mathematics, 21.06.2019 22:00
cassidy wants to cut the yellow fabric into strips that are 0.3 yards wide. how many strips of yellow fabric can cassidy make? yellow fabric 16 yards for $108.00.
Answers: 1


Mathematics, 21.06.2019 22:40
Suppose you are choosing a 6-digit personal access code. this code is made up of 4 digits chosen from 1 to 9, followed by 2 letters chosen from a to z. any of these digits or letters can be repeated. find the total number of personal access codes that can be formed. 492,804 341,172 39,917,124 4,435,236
Answers: 1
You know the right answer?
Questions

Physics, 12.10.2020 19:01


Mathematics, 12.10.2020 19:01

Mathematics, 12.10.2020 19:01


Physics, 12.10.2020 19:01

Mathematics, 12.10.2020 19:01


Computers and Technology, 12.10.2020 19:01

Health, 12.10.2020 19:01


