A graph with both axes numbered 1 to 10. Points show and upward trend.
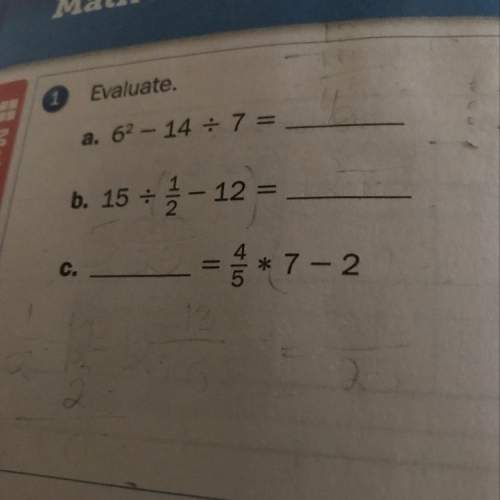
Use the scatterplot and...

Mathematics, 05.04.2020 02:15 monacelli21212owlrlu
A graph with both axes numbered 1 to 10. Points show and upward trend.
Use the scatterplot and line of best fit shown to complete the statements.
When x = 5,
the observed value is . 9
the predicted value is . 7
the residual is . 2

Answers: 1
Another question on Mathematics
Mathematics, 21.06.2019 13:30
Patel’s class voted on their favorite color. patel plans to make a circle graph to display the results. which statements are true about the circle graph patel can create? check all that apply.
Answers: 2
Mathematics, 21.06.2019 17:20
Adrawer contains 12 identical white socks, 18 identical black socks and 14 identical brown socks. what is the least number of socks you must choose, without looking, to be certain that you have chosen two socks of the same colour?
Answers: 3
You know the right answer?
Questions
Mathematics, 14.09.2021 14:00

English, 14.09.2021 14:00
Mathematics, 14.09.2021 14:00

History, 14.09.2021 14:00
Mathematics, 14.09.2021 14:00


History, 14.09.2021 14:00

Computers and Technology, 14.09.2021 14:00
Mathematics, 14.09.2021 14:00
Biology, 14.09.2021 14:00
Mathematics, 14.09.2021 14:00


