
Mathematics, 06.04.2020 23:10 cristinavalencia03
Every few years, the National Assessment of Educational Progress asks a national sample of eighth-graders to perform the same math tasks. The goal is to get an honest picture of progress in math. Suppose these are the last few national mean scores, on a scale of 0 to 500.
Year 1990 1992 1996 2000 2003 2005 2008
Score 263 268 271 272 276 277 279
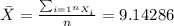
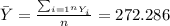
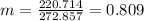
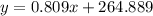
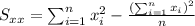
(a) Find the regression line of mean score on time step-by-step. First calculate the mean and standard deviation of each variable and their correlation (use a calculator with these functions). Then find the equation of the least-squares line from these
(b) What percent of the year-to-year variation in scores is explained by the linear trend?

Answers: 1

![r=\frac{n(\sum xy)-(\sum x)(\sum y)}{\sqrt{[n\sum x^2 -(\sum x)^2][n\sum y^2 -(\sum y)^2]}}](/tpl/images/0585/0730/ec454.png)
![r=\frac{7(17647)-(64)(1906)}{\sqrt{[7(858) -(64)^2][7(519164) -(1906)^2]}}=0.97599](/tpl/images/0585/0730/738ef.png)


 and we got:


Another question on Mathematics
Mathematics, 21.06.2019 15:30
According to statistics a person will devote 32 years to sleeping and watching tv. the number of years sleeping will exceed the number of years watching tv by 18. over a lifetime, how many years will the person spend on each of these activities
Answers: 1
Mathematics, 21.06.2019 16:20
Abank gives 6.5% interest per year. what is the growth factor b in this situation?
Answers: 3
Mathematics, 21.06.2019 22:30
Gabrielle's age is two times mikhail's age. the sum of their ages is 84. what is mikhail's age?
Answers: 2
You know the right answer?
Every few years, the National Assessment of Educational Progress asks a national sample of eighth-gr...
Questions

Mathematics, 28.06.2019 13:30
Mathematics, 28.06.2019 13:30


English, 28.06.2019 13:30
English, 28.06.2019 13:30
Mathematics, 28.06.2019 13:30
English, 28.06.2019 13:30

Spanish, 28.06.2019 13:30

Biology, 28.06.2019 13:30

Social Studies, 28.06.2019 13:30


