
Mathematics, 07.04.2020 03:19 whatnowb
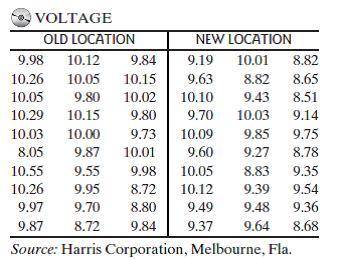
A study was conducted to test whether a manufacturing process performed at a remote location can be established locally. Test devices (pilots) were set up at both the old and new locations and voltage readings on 30 production runs at each location were obtained. The data are reproduced in the table below:
VOLTAGE
Old Location New Location
9.98 10.12 9.84 9.19 10.01 8.82
10.26 10.05 10.15 9.63 8.82 8.65
10.05 9.80 10.02 10.10 9.43 8.51
10.29 10.15 9.80 9.70 10.03 9.14
10.03 10.00 9.73 10.09 9.85 9.75
8.05 9.87 10.01 9.60 9.27 8.78 10.55 9.55 9.98 10.05 8.83 9.35
10.26 9.95 8.72 10.12 9.39 9.54
9.97 9.70 8.80 9.49 9.48 9.36
9.87 8.72 9.84 9.37 9.64 8.68
Required:
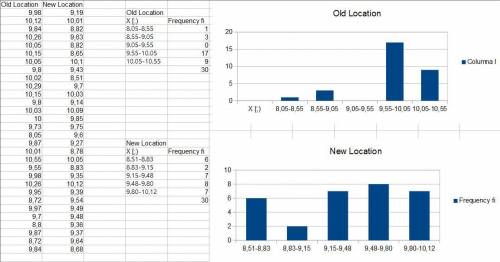
a. Construct a relative frequency histogram for the voltage readings of the old process.
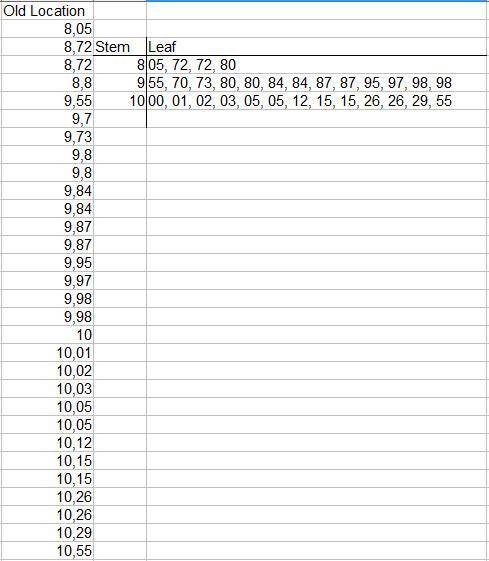
b. Construct a stem-and-leaf display for the voltage readings of the old process. Which of the two graphs in parts a and b is more informative about where most of the voltage readings lie?
c. Construct a relative frequency histogram for the voltage readings of the new process.
d. Compare the two graphs in parts a and c. (You may want to draw the two histograms on the same graph.) Does it appear that the manufacturing process can be established locally (i. e., is the new process as good as or better than the old)?
e. Find and interpret the mean, median, and mode for each of the voltage readings data sets. Which is the preferred measure of central tendency? Explain.
f. Calculate the z-score for a voltage reading of 10.50 at the old location.
g. Calculate the z-score for a voltage reading of 10.50 at the new location.
h. Based on the results of parts f and g, at which location is a voltage reading of 10.50 more likely to occur? Explain.
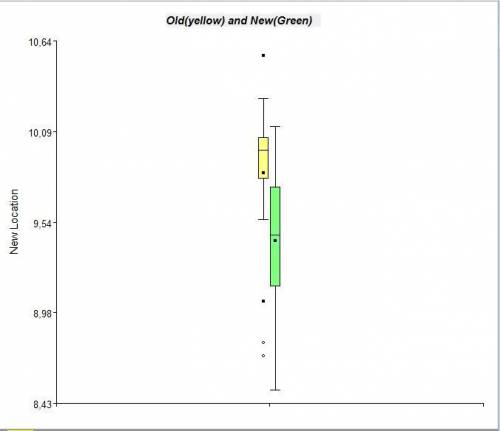
i. Construct a box plot for the data at the old location. Do you detect any outliers?
j. Use the method of z-scores to detect outliers at the old location.
k. Construct a box plot for the data at the new location. Do you detect any outliers?
l. Use the method of z-scores to detect outliers at the new location.
m. Compare the distributions of voltage readings at the two locations by placing the box plots, parts i and k, side by side vertically.

Answers: 2
Another question on Mathematics
Mathematics, 21.06.2019 21:30
Write 5(6x+4)-2(5x-2) in the form a(bx+c) where a,b and c integers and a> 1
Answers: 1
Mathematics, 21.06.2019 22:00
Tom drove 206 miles in 3.9 hours. estimate his average speed.
Answers: 2
Mathematics, 21.06.2019 23:40
Find the amplitude of a sinusoidal function that models this temperature variation
Answers: 2
Mathematics, 22.06.2019 02:00
Find the distance of the blue line between the two labeled points. round to the nearest hundredth. a) 7.07 b) 7.21 c) 10 d) 5.12
Answers: 3
You know the right answer?
A study was conducted to test whether a manufacturing process performed at a remote location can be...
Questions


Computers and Technology, 25.09.2019 22:30


Chemistry, 25.09.2019 22:30
Biology, 25.09.2019 22:30
Mathematics, 25.09.2019 22:30

Biology, 25.09.2019 22:30

Computers and Technology, 25.09.2019 22:30
Mathematics, 25.09.2019 22:30


