
Mathematics, 08.04.2020 00:20 elexiafloyd
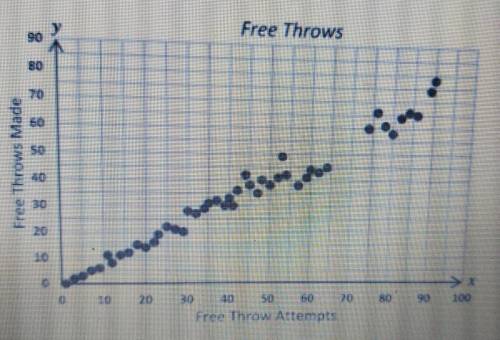
3. The scatterplot shows the number of free throws attempted by players on the high school basketball
team and the number of baskets each player made. Based on the trend in the data approximately how many free throws would a player be predicted to make if he attempted 70 free throws?

Answers: 3
Another question on Mathematics
Mathematics, 21.06.2019 17:00
Find the measure of the interior angles of the following regular polygons: a triangle, a quadrilateral, a pentagon, an octagon, a decagon, a 30-gon, a 50-gon, and a 100-gon.
Answers: 2
Mathematics, 21.06.2019 20:00
Find all solutions for 2y - 4x =2 y = 2x + 1 site: socratic.org
Answers: 1
Mathematics, 21.06.2019 23:30
In the diagram, ab is tangent to c, ab = 4 inches, and ad = 2 inches. find the radius of the circle.
Answers: 3
Mathematics, 22.06.2019 01:30
Talia grouped the terms and factored out the gcf of the groups of the polynomial 15x2 – 3x – 20x + 4. her work is shown below. (15x2 – 3x) + (–20x + 4) 3x(5x – 1) + 4(–5x + 1) talia noticed that she does not have a common factor. what should she do?
Answers: 1
You know the right answer?
3. The scatterplot shows the number of free throws attempted by players on the high school basketbal...
Questions


English, 17.08.2021 22:30

Mathematics, 17.08.2021 22:30

Biology, 17.08.2021 22:30

Social Studies, 17.08.2021 22:30
Mathematics, 17.08.2021 22:30

Mathematics, 17.08.2021 22:30
Mathematics, 17.08.2021 22:30


