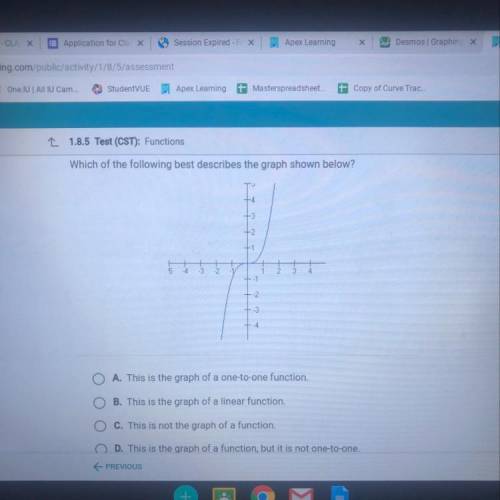
Which of the following best describes the graph shown below?
A. This is the graph of a one-to-...

Mathematics, 09.04.2020 08:53 roxygreeneyes
Which of the following best describes the graph shown below?
A. This is the graph of a one-to-one function.
O
B. This is the graph of a linear function.
O
C. This is not the graph of a function
O
D. This is the graph of a function, but it is not one-to-one.
PREVIOUS

Answers: 3
Another question on Mathematics
Mathematics, 21.06.2019 20:00
The table below represents a linear function f(x) and the equation represents a function g(x): x f(x) −1 −5 0 −1 1 3 g(x) g(x) = 2x − 7 part a: write a sentence to compare the slope of the two functions and show the steps you used to determine the slope of f(x) and g(x). (6 points) part b: which function has a greater y-intercept? justify your answer. (4 points)
Answers: 2
Mathematics, 21.06.2019 20:50
Including 6% sales tax, an inn charges $135.68 per night. find the inns nightly cost
Answers: 1
Mathematics, 22.06.2019 01:00
Match the one-to-one functions with their inverse functions.
Answers: 1
Mathematics, 22.06.2019 01:30
Which point does not lie on the graph k(x) = 8 -3 √x a. (-64, 12) b. (125, 3) c. (343, 1) d. (8, 5)
Answers: 2
You know the right answer?
Questions
Mathematics, 20.09.2020 17:01

Mathematics, 20.09.2020 17:01


Health, 20.09.2020 17:01
Mathematics, 20.09.2020 17:01

Mathematics, 20.09.2020 17:01
English, 20.09.2020 17:01
Geography, 20.09.2020 17:01


