
Mathematics, 11.04.2020 04:47 jaydenbomkamp6084
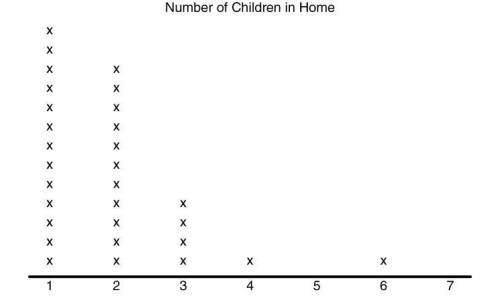
The following dot plot represents a random sample of elementary students and the number of children that live in their home.
If this random sample is representative of elementary students in the United States, which of the following inferences can be made from the data? Select all that apply.
All households in the United States contain at least one child.
Very few households in the United States contain four or more children.
None of the households in the United States contain five children.
The majority of the households in the United States, with at least one child, contain less than three children.

Answers: 2
Another question on Mathematics
Mathematics, 21.06.2019 14:30
Use the radius you found in part i (r=26.8 cm) with the surface area formula below to find the surface area of the sphere. show your work and round your answer to the nearest tenth. the surface area of a sphere: sa = 4πr^2 self note: 3.8.4
Answers: 2
Mathematics, 21.06.2019 16:30
Ahome improvement store rents it’s delivery truck for $19 for the first 75 minutes and $4.75 for each additional 1/4 hour. if a customer rented the truck at 11: 10 am and returned the truck at 1: 40 pm the same day, what would his rental cost be?
Answers: 1
Mathematics, 21.06.2019 17:00
The perimeter of a stage is 116 feet. it is 17 feet wide. how long is it?
Answers: 1
Mathematics, 21.06.2019 20:30
Find the magnitude, correct to two decimal places, made by each of the following with positive direction of the x axis a) y= x the answer is 45° but i don’t know how
Answers: 2
You know the right answer?
The following dot plot represents a random sample of elementary students and the number of children...
Questions
Mathematics, 09.02.2021 06:20

English, 09.02.2021 06:20

Physics, 09.02.2021 06:20
Mathematics, 09.02.2021 06:20
Mathematics, 09.02.2021 06:20

Chemistry, 09.02.2021 06:20

History, 09.02.2021 06:20

Mathematics, 09.02.2021 06:20


