
Mathematics, 14.04.2020 18:55 jaida03
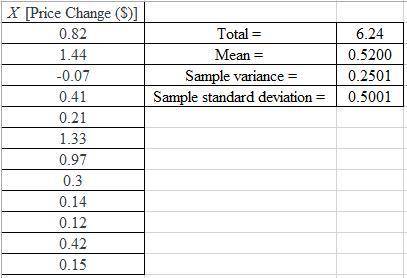
The table showing the stock price changes for a sample of 12 companies on a day is contained in the Excel file below.
Price Change ($)
0.82
1.44
-0.07
0.41
0.21
1.33
0.97
0.30
0.14
0.12
0.42
0.15
Construct a spreadsheet to answer the following questions.
a. Compute the sample variance for the daily price change (to 4 decimals).
b. Compute the sample standard deviation for the price change (to 4 decimals).
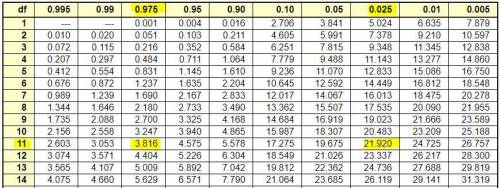
c. Provide 95% confidence interval estimates of the population variance (to 4 decimals).

Answers: 1


 =AVERAGE(A2:A13)
 =VAR.S(A2:A13)
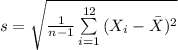
 =STDEV.S(A2:A13)
![CI=[\frac{(n-1)s^{2}}{\chi^{2}_{\alpha/2} } \leq \sigma^{2}\leq \frac{(n-1)s^{2}}{\chi^{2}_{1-\alpha/2} } ]](/tpl/images/0598/7478/a42f6.png)


![=[\frac{(12-1)\times 0.2501}{21.920 } \leq \sigma^{2}\leq \frac{(12-1)\times 0.2501}{3.816} ]](/tpl/images/0598/7478/f887c.png)
![=[0.125506\leq \sigma^{2}\leq 0.720938]\\\approx [0.1255, 0.7210]](/tpl/images/0598/7478/e0a86.png)
Another question on Mathematics
Mathematics, 21.06.2019 17:20
Given: hf || jk; hg ? jg prove: fhg ? kjg to prove that the triangles are congruent by asa, which statement and reason could be used as part of the proof? fgh ? kgj because vertical angles are congruent. jkg ? hfg because vertical angles are congruent. fhg ? jkg because right angles are congruent. hfg ? kjg because alternate interior angles are congruent.
Answers: 1
Mathematics, 21.06.2019 18:00
!! 10 ! a westbound jet leaves central airport traveling 635 miles per hour. at the same time, an eastbound plane departs at 325 miles per hour. in how many hours will the planes be 1900 miles apart?
Answers: 1
Mathematics, 21.06.2019 18:00
Ammonia molecules have three hydrogen atoms and one nitrogen atom.how many of each atom arein five molecules of ammonia
Answers: 1
You know the right answer?
The table showing the stock price changes for a sample of 12 companies on a day is contained in the...
Questions

Mathematics, 09.10.2020 06:01
History, 09.10.2020 06:01

Biology, 09.10.2020 06:01
Mathematics, 09.10.2020 06:01
History, 09.10.2020 06:01


History, 09.10.2020 06:01

Physics, 09.10.2020 06:01
Chemistry, 09.10.2020 06:01


