Which would be an appropriate display for the data shown in the table?

Mathematics, 16.04.2020 05:02 moneywaydaedae
Need ASAP will mark
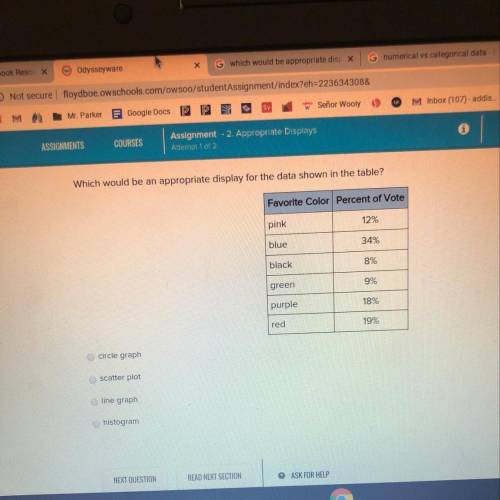
Which would be an appropriate display for the data shown in the table?
Favorite Color Percent of Vote
pink
12%
blue
34%
black
8%
green
9%
purple
18%
red
19%
circle graph
scatter plot
line graph
histogram

Answers: 3
Another question on Mathematics
Mathematics, 21.06.2019 16:40
This question awards 100 ! i really don’t want to fail i will also mark you !
Answers: 2
Mathematics, 21.06.2019 23:00
The ratio of the perimeters of two similar triangles is 4: 3. what are the areas of these triangles if the sum of their areas is 130cm2?
Answers: 3
You know the right answer?
Need ASAP will mark
Which would be an appropriate display for the data shown in the table?
Which would be an appropriate display for the data shown in the table?
Questions

History, 14.12.2021 18:40

Chemistry, 14.12.2021 18:40
Mathematics, 14.12.2021 18:40


English, 14.12.2021 18:40
Social Studies, 14.12.2021 18:40
Mathematics, 14.12.2021 18:50

Mathematics, 14.12.2021 18:50


