
Mathematics, 18.04.2020 03:50 AshyCakes
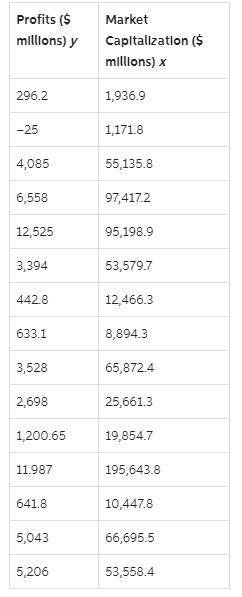
Listed below is data on profit and market capitalization for a sample of 15 different firms in U. S. Profit is the y variable and market capitalization is the x variable
Profits Market Capitalization ($ millions) x
($millions) y
296.2 1,936.9
–25 1,171.8
4,085 55,135.8
6,558 97,417.2
12,525 95,198.9
3,394 53,579.7
442.8 12,466.3
633.1 8,894.3
3,528 65,872.4
2,698 25,661.3
1,200.65 19,854.7
11.987 195,643.8
641.8 10,447.8
5,043 66,695.5
5,206 53,558.4
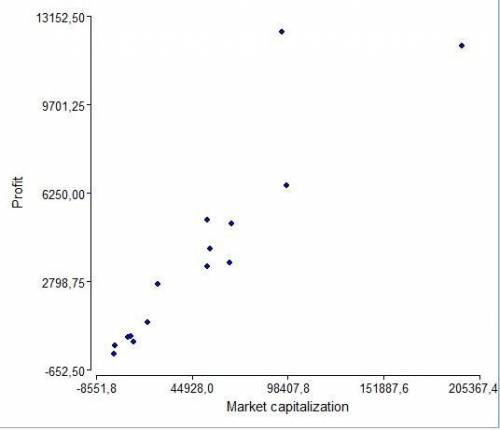
a. Develop a scatter chart for the above data. What does this chart indicate about the relationship between market capitalization and profit?
b. Use the data to develop an estimated regression equation that could be used to estimate a firm’s profit based on its market capitalization. What is the estimated regression model?
c. What is the predicted profit for the market capitalization of 70,721.3 (million)?

Answers: 1
Another question on Mathematics
Mathematics, 21.06.2019 16:00
Write two subtraction equations that are equivalent to 5 + 12 = 17.
Answers: 2
Mathematics, 21.06.2019 18:00
Manny bought 12 pounds of vegetables at the supermarket. 75% of the vegetables were on sale. how many pounds of vegetables were not on sale? 98 points : )
Answers: 2
Mathematics, 21.06.2019 22:00
Rewrite so the subject can be y in the formula d=m-y/y+n
Answers: 1
Mathematics, 21.06.2019 23:00
Complete the conditional statement. if a + 2 < b + 3, then a < b b < a a – b < 1 a < b + 1
Answers: 3
You know the right answer?
Listed below is data on profit and market capitalization for a sample of 15 different firms in U. S....
Questions

Chemistry, 07.03.2020 04:16


English, 07.03.2020 04:16
History, 07.03.2020 04:16
Mathematics, 07.03.2020 04:16


Computers and Technology, 07.03.2020 04:16


