RollL
Use the table showing Manuel's and Gretchen's data to determine the mean, median, standa...

Mathematics, 20.04.2020 17:20 kimhoss2
RollL
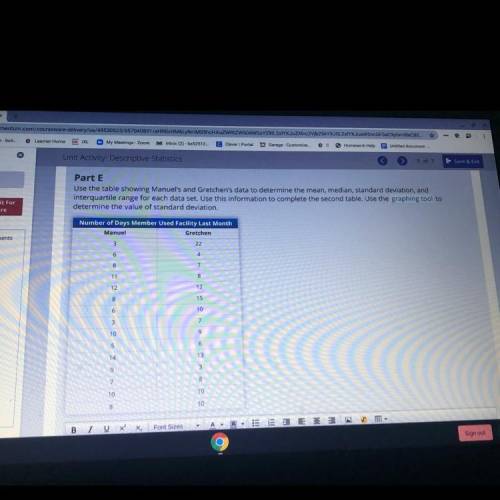
Use the table showing Manuel's and Gretchen's data to determine the mean, median, standard deviation, and
interquartile range for each data set. Use this information to complete the second table. Use the graphing tool to
determine the value of standard deviation.
Number of Days Member Used Facility Last Month
Manuel
Gretchen

Answers: 3
Another question on Mathematics
Mathematics, 21.06.2019 17:30
Describe the 2 algebraic methods you can use to find the zeros of the function f(t)=-16t^2+400.
Answers: 3
Mathematics, 21.06.2019 21:30
Ebuka's monthly rent is $750. if ebuka pays the rent late, his landlord charges 4% interest per week that the payment is late. write a function that gives the total cost r(t), in dollars, of ebuka's rent if he pays it t weeks late.
Answers: 1
Mathematics, 22.06.2019 04:30
What is the measure of angle lkj ? round to the nearest whole degree
Answers: 1
Mathematics, 22.06.2019 05:30
On every three hamburgers that mcdonald’s make they use 9 pickles how many pickles would they use on 99 burgers
Answers: 1
You know the right answer?
Questions

Computers and Technology, 04.07.2020 14:01


History, 04.07.2020 14:01


