
Mathematics, 21.04.2020 22:40 maddy3lizabeth
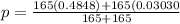
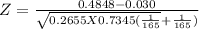
2) The results of a 2012 Pew Foundation survey of high school and middle school teachers is given in the pie chart. A student asked a random sample of teachers in 2018 and found 165 had smart-phones, 80 had a cell phone other than smart-phones, and 5 had no cell phone. Is there a difference in the distribution of types of cell phones for the teachers in 2018 at a 5% level of significance?

Answers: 3
Another question on Mathematics
Mathematics, 21.06.2019 18:30
To determine the number of deer in a forest a forest ranger tags 280 and releases them back
Answers: 3
Mathematics, 21.06.2019 18:30
If the value of x increases by 5, how does the value of m(x + 3) change? a) it increases by 5m. b) it increases by 8m. c) it decreases by 5m. d) it decreases by 8m.
Answers: 1
Mathematics, 21.06.2019 19:30
Two variables, x and y, vary inversely, and x=12 when y=4. what is the value of y when x=3?
Answers: 1
Mathematics, 21.06.2019 22:50
Which best explains why this triangle is or is not a right triangle ?
Answers: 2
You know the right answer?
2) The results of a 2012 Pew Foundation survey of high school and middle school teachers is given in...
Questions


Computers and Technology, 20.02.2020 08:45

Mathematics, 20.02.2020 08:45

Chemistry, 20.02.2020 08:45


History, 20.02.2020 08:45


