
Mathematics, 22.04.2020 23:15 lukeperry
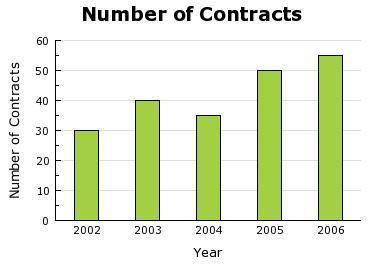
The bar graph shows the number of contracts Company X gained each year from 2002 to 2006. Over which of the periods was the average rate of increase for number of Contracts for Company X the smallest?
A) From 2002 through 2003
B) From 2002 through 2004
C) From 2004 through 2005
D) From 2004 through 2006

Answers: 3
Another question on Mathematics
Mathematics, 21.06.2019 20:30
Astore ordered 750 candles a total wholesale cost of $7910.20. the soy candles cosy $12.17 each and thespecialty candles cost $9.58each. how many of each were bought?
Answers: 1
Mathematics, 21.06.2019 21:10
See attachment below and find the equivalent of tan(∠qsr)
Answers: 3
Mathematics, 22.06.2019 02:10
Iknow the answer but the calculator doesn't seem to give the right one
Answers: 1
You know the right answer?
The bar graph shows the number of contracts Company X gained each year from 2002 to 2006. Over which...
Questions

Mathematics, 02.03.2020 23:58


Computers and Technology, 02.03.2020 23:58


English, 02.03.2020 23:58
Mathematics, 02.03.2020 23:58


