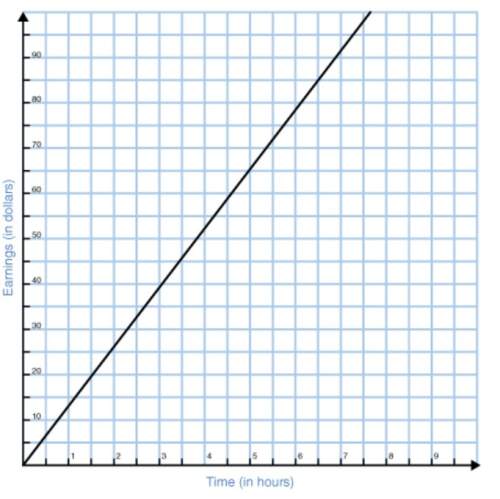
Find the residual values, and use the graphing calculator tool to make a residual plot.
...

Mathematics, 23.04.2020 23:33 kaliyab191
Find the residual values, and use the graphing calculator tool to make a residual plot.
A 4-column table with 5 rows. The first column is labeled x with entries 1, 2, 3, 4, 5. The second column is labeled given with entries negative 2.7, negative 0.9, 1.1, 3.2, 5.4. The third column is labeled predicted with entries negative 2.84, negative 0.81, 1.22, 3.25, 5.28. The fourth column is labeled residual value with all entries blank.
Does the residual plot show that the line of best fit is appropriate for the data?
No, the points are in a curved pattern.

Answers: 2
Another question on Mathematics


Mathematics, 21.06.2019 20:00
The function models the number of accidents per 50 million miles driven as a function
Answers: 1

Mathematics, 21.06.2019 22:00
What is the equation of the line that is parallel to the line with the equation y= -3/4x +1 and passes through the point (12,-12)
Answers: 1

Mathematics, 21.06.2019 22:30
Given the system of equations presented here: 2x + 4y = 14 4x + y = 20 which of the following actions creates an equivalent system such that, when combined with the other equation, one of the variables is eliminated? multiply the second equation by â’4 to get â’16x â’ 4y = â’80 multiply the second equation by â’1 to get â’4x â’ y = â’20 multiply the first equation by 2 to get 4x + 8y = 28 multiply the first equation by â’1 to get â’2x â’ 4y = â’14
Answers: 1
You know the right answer?
Questions

Mathematics, 11.05.2021 06:00

Chemistry, 11.05.2021 06:00

English, 11.05.2021 06:00


Mathematics, 11.05.2021 06:00

English, 11.05.2021 06:00


Advanced Placement (AP), 11.05.2021 06:00


Business, 11.05.2021 06:00

History, 11.05.2021 06:00


