Price
200
Month
Which graph appears to show the best performance? Which scale make...

Mathematics, 24.04.2020 08:00 alexandrecarmene
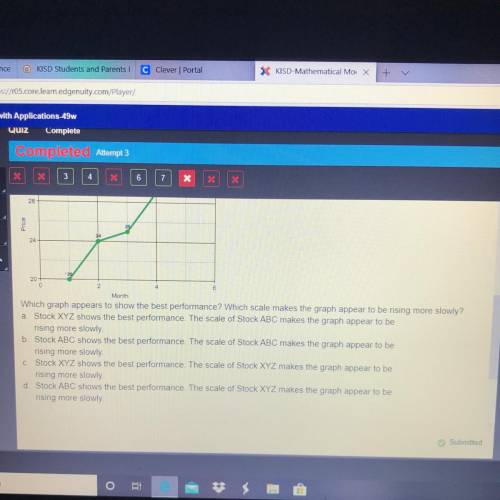
Price
200
Month
Which graph appears to show the best performance? Which scale makes the graph appear to be rising more slowly?
a. Stock XYZ shows the best performance. The scale of Stock ABC makes the graph appear to be
rising more slowly
b. Stock ABC shows the best performance. The scale of Stock ABC makes the graph appear to be
rising more slowly
C. Stock XYZ shows the best performance. The scale of Stock XYZ makes the graph appear to be
rising more slowly
d Stock ABC shows the best performance. The scale of Stock XYZ makes the graph appear to be
rising more slowly

Answers: 2
Another question on Mathematics
Mathematics, 21.06.2019 23:00
Solve the system of equations using the linear combination method. {4x−3y=127x−3y=3 enter your answers in the boxes.
Answers: 1
Mathematics, 21.06.2019 23:30
Atruck can be rented from company a $50 a day plus $0.60 per mile. company b charges $20 a day plus $0.80 per mile to rent the same truck. find the number of miles in a day at which the rental costs for company a and company b are the same
Answers: 1
Mathematics, 22.06.2019 03:40
(25 ! ) what does it mean for an equation to have no solution or infinitely many solutions?
Answers: 1
You know the right answer?
Questions

Health, 26.03.2020 20:59
Mathematics, 26.03.2020 20:59
Mathematics, 26.03.2020 20:59


Chemistry, 26.03.2020 20:59


Law, 26.03.2020 20:59


Social Studies, 26.03.2020 20:59


