
Mathematics, 24.04.2020 20:36 catsareokiguess
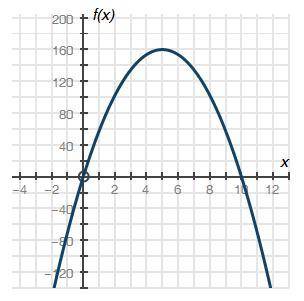
The graph below shows a company's profit f(x), in dollars, depending on the price of pencils x, in dollars, sold by the company:
Graph of quadratic function f of x having x intercepts at ordered pairs negative 0, 0 and 10, 0. The vertex is at 5, 160.
Part A: What do the x-intercepts and maximum value of the graph represent? What are the intervals where the function is increasing and decreasing, and what do they represent about the sale and profit? (4 points)
Part B: What is an approximate average rate of change of the graph from x = 2 to x = 5, and what does this rate represent? (3 points)
Part C: Describe the constraints of the domain. (3 points)

Answers: 3
Another question on Mathematics
Mathematics, 21.06.2019 17:00
Ifurniture stores having a weekend sale and is offering 20% discount on patio chairs and table the sales tax on furniture is 6.25 using function composition how can you represent the total amount a that you would need to pay for this furniture that cost x dollars
Answers: 1
Mathematics, 21.06.2019 18:00
Ageologist had two rocks on a scale that weighed 4.6 kilograms together.rock a was 0.5 of the total weight.how much did rock a weigh?
Answers: 1
You know the right answer?
The graph below shows a company's profit f(x), in dollars, depending on the price of pencils x, in d...
Questions
Mathematics, 22.02.2021 22:30


Physics, 22.02.2021 22:30


History, 22.02.2021 22:30
Mathematics, 22.02.2021 22:30

Geography, 22.02.2021 22:30
History, 22.02.2021 22:30


