The dot plots below show the scores for a group of students for two rounds of a quiz:
Wh...

Mathematics, 24.04.2020 20:31 adalan6986
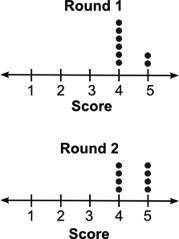
The dot plots below show the scores for a group of students for two rounds of a quiz:
Which of the following inferences can be made using the dot plots?
There is no overlap between the data.
The range of each round is the same.
Round 1 scores are higher than round 2 scores.
Round 2 scores are lower than round 1 scores.

Answers: 1
Another question on Mathematics
Mathematics, 21.06.2019 18:00
Suppose you are going to graph the data in the table. minutes temperature (°c) 0 -2 1 1 2 3 3 4 4 5 5 -4 6 2 7 -3 what data should be represented on each axis, and what should the axis increments be? x-axis: minutes in increments of 1; y-axis: temperature in increments of 5 x-axis: temperature in increments of 5; y-axis: minutes in increments of 1 x-axis: minutes in increments of 1; y-axis: temperature in increments of 1 x-axis: temperature in increments of 1; y-axis: minutes in increments of 5
Answers: 2
Mathematics, 21.06.2019 19:30
Complete the solution of the equation. find the value of y when x equals to 28 x+3y=28
Answers: 2
Mathematics, 21.06.2019 21:00
X+y=-4 x-y=2 use elimination with adding and subtraction
Answers: 3
Mathematics, 21.06.2019 21:40
Ineed your ! i was to turn this into pond first thing i gotta do is outline the inside with this plastic how big should i cut the plastic the height: 10 1/2” the length: 40” the width: 12” me !
Answers: 1
You know the right answer?
Questions
Mathematics, 15.10.2019 13:20

History, 15.10.2019 13:20

Computers and Technology, 15.10.2019 13:20

Social Studies, 15.10.2019 13:20
Mathematics, 15.10.2019 13:20


Social Studies, 15.10.2019 13:20

Mathematics, 15.10.2019 13:20
Mathematics, 15.10.2019 13:20
Mathematics, 15.10.2019 13:20


