
Mathematics, 25.04.2020 07:20 dijaflame67
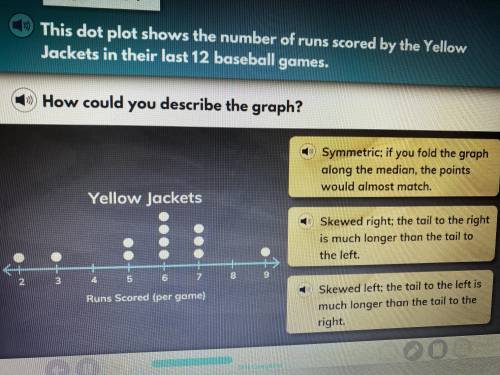
This dot plot shows the number of runs scored by the Yellow Jackets in their last 12 baseball games. How could you describe the graph?

Answers: 2
Another question on Mathematics
Mathematics, 21.06.2019 16:20
7.(03.01 lc)which set represents the range of the function shown? {(-1, 5), (2,8), (5, 3), 13, -4)} (5 points){-1, 2, 5, 13){(5, -1), (8, 2), (3,5), (-4, 13)){-4, 3, 5, 8}{-4, -1, 2, 3, 5, 5, 8, 13}
Answers: 3
Mathematics, 21.06.2019 18:30
What is the perimeter of a rectangular building that is 80 feet wide and 140 feet deep?
Answers: 1
Mathematics, 21.06.2019 19:30
Need now max recorded the heights of 500 male humans. he found that the heights were normally distributed around a mean of 177 centimeters. which statements about max’s data must be true? a) the median of max’s data is 250 b) more than half of the data points max recorded were 177 centimeters. c) a data point chosen at random is as likely to be above the mean as it is to be below the mean. d) every height within three standard deviations of the mean is equally likely to be chosen if a data point is selected at random.
Answers: 1
Mathematics, 21.06.2019 21:00
Tessa bought stock in a restaurant for $253.00. her stock is now worth $333.96. what is the percentage increase of the value of tessa's stock? a.) 81% b.) 32% c.) 24% d.) 76%
Answers: 1
You know the right answer?
This dot plot shows the number of runs scored by the Yellow Jackets in their last 12 baseball games....
Questions

History, 01.10.2021 14:40

History, 01.10.2021 14:40

Chemistry, 01.10.2021 14:40

Business, 01.10.2021 14:40
Mathematics, 01.10.2021 14:40
Mathematics, 01.10.2021 14:40

Law, 01.10.2021 14:40
Mathematics, 01.10.2021 14:40
Business, 01.10.2021 14:40


French, 01.10.2021 14:40
Biology, 01.10.2021 14:40


