
Mathematics, 27.04.2020 03:16 sickboi
The principal at Crest Middle School, which enrolls only sixth-grade students and seventh-grade students, is interested in determining how much time students at that school spend on homework each night. The table below shows the mean and standard deviation of the amount of time spent on homework each night (in minutes) for a random sample of 20 sixth-grade students and a separate random sample of 20 seventh-grade students at this school. Based on dotplots of these data, it is not unreasonable to assume that the distribution of times for each grade were approximately normally distributed.
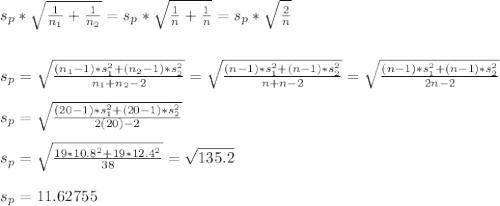
Estimate the difference in mean times spent on homework for all sixth- and seventh-grade students in this school using an interval. Be sure to interpret your interval.
An assistant principal reasoned that a much narrower confidence interval could be obtained if the students were paired based on their responses; for example, pairing the sixth-grade student and the seventh-grade student with the highest number of minutes spent on homework, the sixth-grade student and seventh-grade student with the next highest number of minutes spent on homework, and so on. Is the assistant principal correct in thinking that matching students in this way and then computing a matched-pairs confidence interval for the mean difference in time spent on homework is a better procedure than the one used in part (a) ? Explain why or why not.

Answers: 3
Another question on Mathematics
Mathematics, 21.06.2019 15:00
Jeffery conducted a survey in his school and found that 30 of the 50 eighth grade students' favorite subject is mathematics. based on the results, jeffery concluded that out of the 200 students in his school, 120 students' favorite subject is mathematics. select the statement that is true about jeffery's conclusion. a. jeffery's conclusion is not valid because the sample was biased since only 200 students were surveyed. b. jeffery's conclusion is valid because the sample was random since all of the students were eighth grade students. c. jeffery's conclusion is valid because the sample was random. d. jeffery's conclusion is not valid because the sample was biased since all of the students were eighth grade students.
Answers: 2
Mathematics, 21.06.2019 19:00
Jack did 3/5 of all problems on his weekend homework before sunday. on sunday he solved 1/3 of what was left and the last 4 problems. how many problems were assigned for the weekend?
Answers: 3
Mathematics, 21.06.2019 21:30
The price of a visit to the dentist is calculated according to the formula 50+100n50+100n where nn is the number of cavities the dentist finds. on your last visit to the dentist, 22 cavities were found. what was the cost of your visit?
Answers: 2
You know the right answer?
The principal at Crest Middle School, which enrolls only sixth-grade students and seventh-grade stud...
Questions
Mathematics, 04.02.2020 15:51
Mathematics, 04.02.2020 15:51


Physics, 04.02.2020 15:51


Social Studies, 04.02.2020 15:51
Mathematics, 04.02.2020 15:51


History, 04.02.2020 15:51
Social Studies, 04.02.2020 15:51
History, 04.02.2020 15:51
Chemistry, 04.02.2020 15:51


