
Mathematics, 06.05.2020 05:58 maddie7155
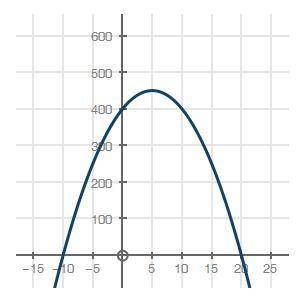
A biologist created the following graph to show the relationship between the temperature of water (x), in degrees Celsius, and the number of insect larvae (y) in the water:
What does the peak of the graph represent?
The number of larvae in the water is greatest at 450 degrees Celsius.
The number of larvae in the water is greatest at 5 degrees Celsius.
The least number of larvae in the water is 450.
The least number of larvae in the water is 5.

Answers: 3
Another question on Mathematics
Mathematics, 21.06.2019 18:00
An appliance store sells lamps at $95.00 for two. a department store sells similar lamps at 5 for $250.00. which store sells at a better rate
Answers: 1
Mathematics, 21.06.2019 21:30
Which of the following is a solution of z^6 = 64i? 2(cos105° + isin105°) 2(cos120° + isin120°) 2(cos135° + isin135°) 8(cos15° + isin15°)
Answers: 1
Mathematics, 22.06.2019 03:00
The length of the shadow of a building is 120 meters, as shown below: building shadow 120 m what is the height of the building? (1 point)
Answers: 1
Mathematics, 22.06.2019 04:20
When booking personal travel by air, one is always interested in actually arriving at one’s final destination even if that arrival is a bit late. the key variables we can typically try to control are the number of flight connections we have to make in route, and the amount of layover time we allow in those airports whenever we must make a connection. the key variables we have less control over are whether any particular flight will arrive at its destination late and, if late, how many minutes late it will be. for this assignment, the following necessarily-simplified assumptions describe our system of interest: the number of connections in route is a random variable with a poisson distribution, with an expected value of 1. the number of minutes of layover time allowed for each connection is based on a random variable with a poisson distribution (expected value 2) such that the allowed layover time is 15*(x+1). the probability that any particular flight segment will arrive late is a binomial distribution, with the probability of being late of 50%. if a flight arrives late, the number of minutes it is late is based on a random variable with an exponential distribution (lamda = .45) such that the minutes late (always rounded up to 10-minute values) is 10*(x+1). what is the probability of arriving at one’s final destination without having missed a connection? use excel.
Answers: 3
You know the right answer?
A biologist created the following graph to show the relationship between the temperature of water (x...
Questions
Mathematics, 09.10.2020 22:01

Health, 09.10.2020 22:01

Chemistry, 09.10.2020 22:01

History, 09.10.2020 22:01

Geography, 09.10.2020 22:01
Mathematics, 09.10.2020 22:01

Advanced Placement (AP), 09.10.2020 22:01

History, 09.10.2020 22:01


