
Mathematics, 06.05.2020 04:01 bm42400
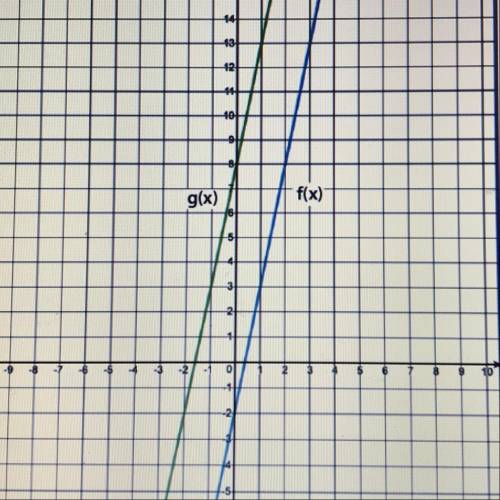
The linear functions f(x) and g(x) are represented on the graph, where g(x) is a transformation of f(x).
Part A: describe two types of transformations that can be used to transform f(x) to g(x).
Part B: solve for k in each type of transformation.
Part C: write an equation for each type of transformation that can be used to transform f(x) to g(x)

Answers: 3
Another question on Mathematics
Mathematics, 21.06.2019 17:40
How can the correlation in the scatter plot graph below best be described? positive correlation negative correlation both positive and negative no correlation
Answers: 1
Mathematics, 21.06.2019 18:10
Josh has a rewards card for a movie theater he receives 15 points for becoming a rewards card holder he earns 3.5 points for each visit to the movie theater he needs at least 55 points to earn a free movie ticket which inequality can josh use to determine x, the minimum number of visits he needs to earn his first free movie ticket.
Answers: 1
Mathematics, 21.06.2019 21:30
Create a graph for the demand for starfish using the following data table: quantity/price of starfish quantity (x axis) of starfish in dozens price (y axis) of starfish per dozen 0 8 2 6 3 5 5 2 7 1 9 0 is the relationship between the price of starfish and the quantity demanded inverse or direct? why? how many dozens of starfish are demanded at a price of five? calculate the slope of the line between the prices of 6 (quantity of 2) and 1 (quantity of 7) per dozen. describe the line when there is a direct relationship between price and quantity.
Answers: 3
You know the right answer?
The linear functions f(x) and g(x) are represented on the graph, where g(x) is a transformation of f...
Questions

History, 12.03.2021 01:00
History, 12.03.2021 01:00

English, 12.03.2021 01:00
Mathematics, 12.03.2021 01:00

Social Studies, 12.03.2021 01:00

Biology, 12.03.2021 01:00

Geography, 12.03.2021 01:00
Mathematics, 12.03.2021 01:00
History, 12.03.2021 01:00
Mathematics, 12.03.2021 01:00
Mathematics, 12.03.2021 01:00

Biology, 12.03.2021 01:00


