
Mathematics, 05.05.2020 20:03 voidnyaah
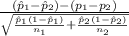
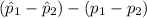
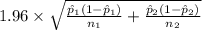
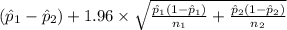
Let p1 represent the population proportion of U. S. Senate and Congress (House of Representatives) democrats who are in favor of a new modest tax on "junk food". Let p2 represent the population proportion of U. S. Senate and Congress (House of Representatives) republicans who are in favor of a new modest tax on "junk food". Out of the 265 democratic senators and congressman 106 of them are in favor of a "junk food" tax. Out of the 275 republican senators and congressman only 57 of them are in favor of a "junk food" tax. Find a 95 percent confidence interval for the difference between proportions l and 2.

Answers: 1
 ~ N(0,1)
 = sample proportion of democratic senators and congressman who are in favor of a "junk food" tax =
  = 0.40
 = sample proportion of republican senators and congressman who are in favor of a "junk food" tax =
  = 0.21
 = sample of democratic senators and congressman = 265
 = sample of republican senators and congressman = 275
 = population proportion of U.S. Senate and Congress democrats who are in favor of a new modest tax on "junk food"
 = population proportion of U.S. Senate and Congress republicans who are in favor of a new modest tax on "junk food"
 ) is ;
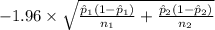 <
<  <
<  ) = 0.95
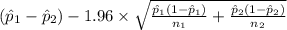 <
<  <
<  ) = 0.95
 ,
, ]
]Another question on Mathematics
Mathematics, 21.06.2019 18:30
Abouncy ball is released from a certain height. on the first bounce, it travels 32cm. with each subsequent bounce, it travels 9/10 the distance of the previous bounce. what is the total distance that the ball has traveled when it completes its 25th bounce?
Answers: 1
Mathematics, 21.06.2019 20:00
Last one and the bottom answer choice is y=(x-4)^2+1 you guys!
Answers: 1
Mathematics, 21.06.2019 22:30
James wants to promote his band on the internet. site a offers website hosting for $4.95 per month with a $49.95 startup fee. site b offers website hosting for $9.95 per month with no startup fee. for how many months would james need to keep the website for site a to be a better choice than site b?
Answers: 1
Mathematics, 22.06.2019 09:00
The table and the graph below each show a different relationship between the same two variables, x and y: a table with two columns and 5 rows is shown. the column head for the left column is x, and the column head for the right column is y. the row entries in the table are 4,100 and 5,125 and 6,150 and 7,175. on the right of this table is a graph. the x-axis values are from 0 to 10 in increments of 2 for each grid line. the y-axis values on the graph are from 0 to 300 in increments of 60 for each grid line. a line passing through the ordered pairs 2, 60 and 4, 120 and 6, 180 and 8, 240 is drawn. how much more would the value of y be on the graph than its value in the table when x = 12? 20 30 60 70
Answers: 1
You know the right answer?
Let p1 represent the population proportion of U. S. Senate and Congress (House of Representatives) d...
Questions
Mathematics, 15.07.2020 01:01
Mathematics, 15.07.2020 01:01

English, 15.07.2020 01:01


Computers and Technology, 15.07.2020 01:01
Computers and Technology, 15.07.2020 01:01


Computers and Technology, 15.07.2020 01:01


