
MODELING A WATER WHEEL
The data from the previous table is plotted to the right. The dist...

Mathematics, 05.05.2020 18:15 jasminelara740
MODELING A WATER WHEEL
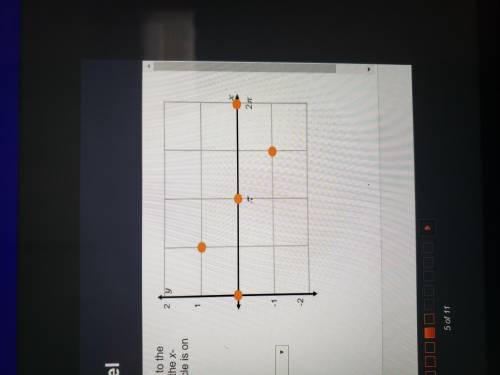
The data from the previous table is plotted to the right. The distance the boat traveled is on the x-axis, and the vertical position of the barnacle is on the y-axis.
ANSWERS
The graph follows the zero-max-zero-min-zero pattern.
This is the pattern for a sine function.
The amplitude is 1
The vertical shift is 0
An equation for this graph is y = sin(x)

Answers: 1
Another question on Mathematics
Mathematics, 21.06.2019 16:40
One of the inventors of integrated circuits observed that the number of transistors that fit on an integrated circuit will double every 24 months. what type of relationship most appropriately models this situation?
Answers: 3
Mathematics, 22.06.2019 00:30
On ryan's last social studies test there were two types of questions true/false worth 3 points each and multiple choice questions worth 4 points each
Answers: 3
Mathematics, 22.06.2019 01:10
The graph below shows the line of best fit for data collected on the number of cell phones and cell phone cases sold at a local electronics store on twelve different days. number of cell phone cases sold 50 * 0 5 10 15 20 25 30 35 40 45 number of cell phones sold which of the following is the equation for the line of best fit? a. y = 0.8x b. y = 0.2x c. y=0.5x d. y = 0.25x
Answers: 3
Mathematics, 22.06.2019 02:00
Ineed on the last 8 questions for this homework i’m trying to get all this done by tuesday when i got to my level 5 teacher if i have passed my tabe
Answers: 1
You know the right answer?
Questions

Mathematics, 02.02.2022 21:10


SAT, 02.02.2022 21:10

Computers and Technology, 02.02.2022 21:10

SAT, 02.02.2022 21:10


