
Mathematics, 05.05.2020 12:11 hmontalvo22
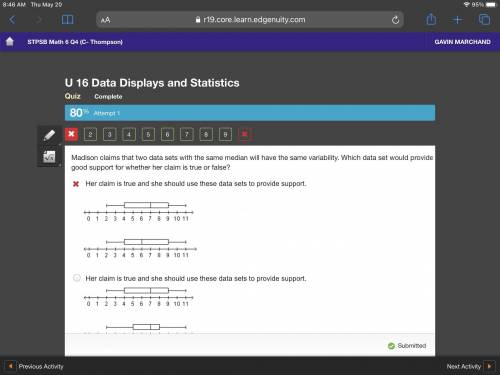
Madison claims that two data sets with the same median will have the same variability. Which data set would provide good support for whether her claim is true or false?
Her claim is true and she should use these data sets to provide support.
A box-and-whisker plot. The number line goes from 0 to 11. The whiskers range from 2 to 11, and the box ranges from 4 to 9. A line divides the box at 7.
A box-and-whisker plot. The number line goes from 0 to 11. The whiskers range from 2 to 11, and the box ranges from 4 to 9. A line divides the box at 6.
Her claim is true and she should use these data sets to provide support.
A box-and-whisker plot. The number line goes from 0 to 11. The whiskers range from 2 to 11, and the box ranges from 4 to 9. A line divides the box at 7.
A box-and-whisker plot. The number line goes from 0 to 11. The whiskers range from 2 to 11, and the box ranges from 5 to 8. A line divides the box at 7.
Her claim is false and she should use these to show that two data sets with the same median can have different variability.
A box-and-whisker plot. The number line goes from 0 to 11. The whiskers range from 2 to 11, and the box ranges from 4 to 9. A line divides the box at 7.
A box-and-whisker-plot. The number line goes from 0 to 11. The whiskers range from 2 to 11, and the box ranges from 5 to 8. a line divides the box at 7.
Her claim is false and she should use these to show that two data sets with the same median can have different variability.
A box-and-whisker plot. The number line goes from 0 to 11. The whiskers range from 2 to 11, and the box ranges from 4 to 9. A line divides the box at 7.
A box-and-whisker-plot. The number line goes from 0 to 11. The whiskers range from 2 to 11, and the box ranges from 5 to 8. a line divides the box at 5.5.

Answers: 3

Another question on Mathematics
Mathematics, 21.06.2019 12:30
In the diagram below what is the approximate length of the minor arc ab
Answers: 1
Mathematics, 21.06.2019 15:30
What is the volume of a rectangular prism that is 120 centimeters by 2 meters by 1.5 meters in cubic meters?
Answers: 1
Mathematics, 21.06.2019 17:00
In tossing one coin 10 times, what are your chances for tossing a head? a tail? 2. in tossing one coin 100 times, what are your chances for tossing a head? a tail? 3. in tossing one coin 200 times, what are your chances for tossing a head? a tail? deviation = ((absolute value of the difference between expected heads and observed heads) + (absolute value of the difference between expected tails and observed tails)) divided by total number of tosses. this value should always be positive. 4. what is the deviation for 10 tosses? 5. what is the deviation for the 100 tosses? 6. what is the deviation for 200 tosses? 7. how does increasing the total number of coin tosses from 10 to 100 affect the deviation? 8. how does increasing the total number of tosses from 100 to 200 affect the deviation? 9. what two important probability principles were established in this exercise? 10. the percent of occurrence is the obtained results divided by the total tosses and multiplied by 100%. toss the coins 100 times and record your results. calculate the percent occurrence for each combination. percent head-head occurrence: percent tail-tail occurrence: percent head-tail occurrence:
Answers: 3
Mathematics, 22.06.2019 05:00
Rachel is baking a cake but does not know if she wants to make a round or a square cake which cake has a larger area a round 8 inch cake or a square 9 inch cake
Answers: 3
You know the right answer?
Madison claims that two data sets with the same median will have the same variability. Which data se...
Questions
Mathematics, 22.01.2021 21:20

Arts, 22.01.2021 21:20

Engineering, 22.01.2021 21:20
Mathematics, 22.01.2021 21:20
Mathematics, 22.01.2021 21:20

English, 22.01.2021 21:20

Biology, 22.01.2021 21:20

Social Studies, 22.01.2021 21:20

Geography, 22.01.2021 21:20
Mathematics, 22.01.2021 21:20
Mathematics, 22.01.2021 21:20
English, 22.01.2021 21:20


