Otto has some whipping cream that is 30% butterfat and some milk that is 2% butterfat.
He...

Mathematics, 05.05.2020 04:35 datboyjulio21
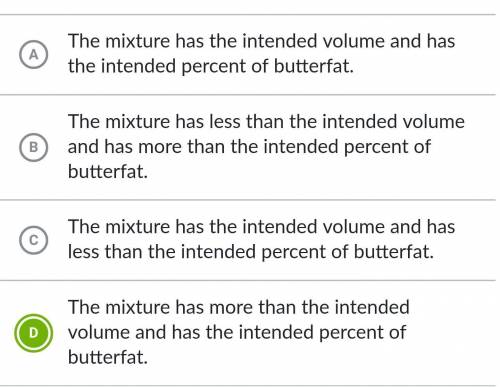
Otto has some whipping cream that is 30% butterfat and some milk that is 2% butterfat.
He wants to make a 500 mL mixture of them that is 12% butterfat.
Here's a graph that shows a system of equations for this scenario where x is the volume of whipping cream he uses and y is the volume of milk he uses.

Answers: 1
Another question on Mathematics
Mathematics, 21.06.2019 20:10
Gexpressions: practice question 3 of 5 jackson wants to study the popularity of his music video by tracking the number of views the video gets on his website. the expression below represents the total number of views that jackson's video receives n days after he begins tracking the nu views, where b is the rate at which the number of views changes. alb)" select the statement that would accurately describe the effect of tripling a, the initial number of views before jackson beginst the rate at which the number of views changes, b, will triple. the total number of views the video has after n days, a(b)", will not change. the total number of days since jackson begins tracking views, n, will be reduced by one-third. the total number of views the video has after n days, alb)", will triple. submit
Answers: 3
Mathematics, 21.06.2019 23:30
The number of members f(x) in a local swimming club increased by 30% every year over a period of x years. the function below shows the relationship between f(x) and x: f(x) = 10(1.3)xwhich of the following graphs best represents the function? graph of f of x equals 1.3 multiplied by 10 to the power of x graph of exponential function going up from left to right in quadrant 1 through the point 0, 0 and continuing towards infinity graph of f of x equals 10 multiplied by 1.3 to the power of x graph of f of x equals 1.3 to the power of x
Answers: 1
Mathematics, 22.06.2019 00:30
When you flip a biased coin the probability of getting a tail is 0.6. how many times would you expect to get tails if you flip the coin 320 times?
Answers: 1
Mathematics, 22.06.2019 00:30
An unknown number x is at most 10. which graph best represents all the values of x? number line graph with closed circle on 10 and shading to the right. number line graph with open circle on 10 and shading to the right. number line graph with open circle on 10 and shading to the left. number line graph with closed circle on 10 and shading to the left.
Answers: 1
You know the right answer?
Questions
Mathematics, 23.07.2019 01:00

Mathematics, 23.07.2019 01:00
Mathematics, 23.07.2019 01:00
Mathematics, 23.07.2019 01:00

Social Studies, 23.07.2019 01:00
Mathematics, 23.07.2019 01:00


Health, 23.07.2019 01:00
History, 23.07.2019 01:00
Social Studies, 23.07.2019 01:00
History, 23.07.2019 01:00

Biology, 23.07.2019 01:00


