HELP AGAIN
Male and female high school students reported how many hours they worked each week...

Mathematics, 03.05.2020 13:58 mommytobe2019
HELP AGAIN
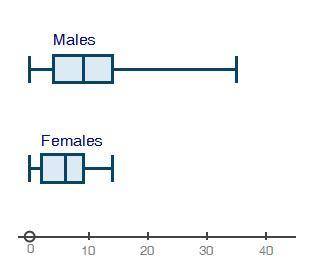
Male and female high school students reported how many hours they worked each week in summer jobs. The data is represented in the following box plots:
two box plots shown. The top one is labeled Males. Minimum at 0, Q1 at 3, median at 10, Q3 at 15, maximum at 35. The bottom box plot is labeled Females. Minimum at 0, Q1 at 2, median at 6, Q3 at 9, maximum at 14
Identify any values of data that might affect the statistical measures of spread and center. (2 points)
Group of answer choices
The zero hour mark on both plots prevents the graphs from being balanced.
The median is near the center of the IQR for both males and females.
There is not enough evidence to see any effects on spread or center.
The males have a suspected significant high outlier.

Answers: 1
Another question on Mathematics
Mathematics, 21.06.2019 15:00
Acircular hot tub located near the middle of a rectangular patio has a diameter of 48 inches. the patio measures 11 feet by 6 feet. what is the area of the patio that is not covered by the hot tub?
Answers: 1
Mathematics, 21.06.2019 23:40
What is the area of a rectangle with vertices (-8,-2), (-3,-2), (-3,-6), and (-8,-6)? units
Answers: 1
Mathematics, 22.06.2019 02:40
If /is a line of symmetry, plot the partner points for the ones shown. noch 6 5 4 -3 -2 -1
Answers: 1
Mathematics, 22.06.2019 03:30
Arock was dropped from the top of a building. the function that describes the height after it was dropped is f(x)=64-16x^2. what are the zeros of the function and what do they mean?
Answers: 1
You know the right answer?
Questions
Mathematics, 25.04.2020 03:50

Mathematics, 25.04.2020 03:50
Mathematics, 25.04.2020 03:50


Biology, 25.04.2020 03:50

Physics, 25.04.2020 03:50


