The graph shows a proportional relationship between
the number of computers produced at a facto...

Mathematics, 07.05.2020 03:59 krlx
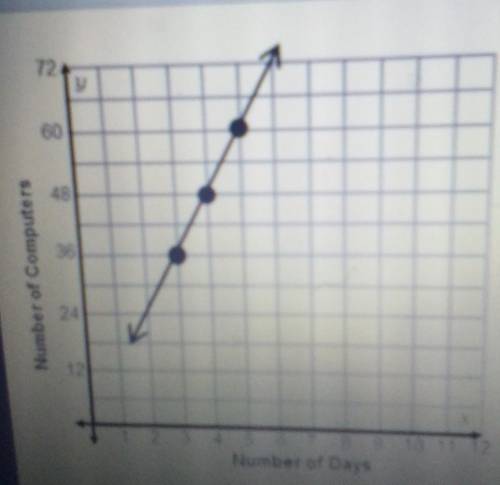
The graph shows a proportional relationship between
the number of computers produced at a factory per day.
In three days, 36 computers are produced: 48
computers are produced in 4 days and 60 computers
are produced in 5 days.
Find the unit rate of computers per day using the graph.
What is theunit rate?

Answers: 1
Another question on Mathematics
Mathematics, 21.06.2019 17:00
Which graph corresponds to the function f(x) = x2 + 4x – 1?
Answers: 1
Mathematics, 21.06.2019 23:30
Which function represents the sequence? f(n)=n+3 f(n)=7n−4 f(n)=3n+7 f(n)=n+7
Answers: 1
Mathematics, 22.06.2019 01:40
Which of the following is the major negative aspect of crossover designs for research studies? a. prohibitive cost b. residual effects c-subject drepout d. incomplete randomization e. large sample size required
Answers: 1
You know the right answer?
Questions


Biology, 24.07.2019 06:30

History, 24.07.2019 06:30
History, 24.07.2019 06:30


Mathematics, 24.07.2019 06:30
History, 24.07.2019 06:30
History, 24.07.2019 06:30


