
Mathematics, 17.05.2020 23:57 aredwolf2017
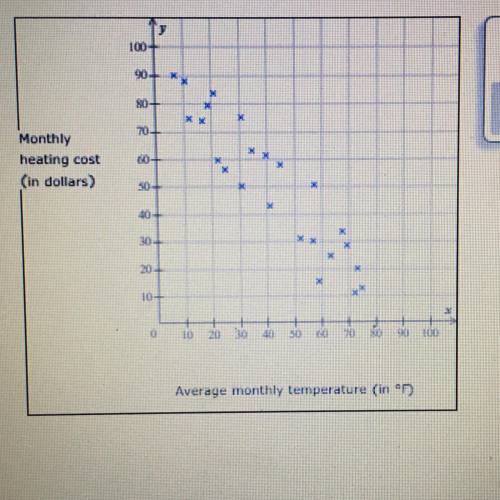
The scatter plot shows the average monthly temperature, X, and a family's monthly heating cost, y, for 24 different months.
(a) Write an approximate equation of the line of best fit for the data. It doesn't have to be the exact line of best fit.
(b) Using your equation from part (a), predict the monthly heating cost for a month with an average temperature of 45 °F.
Note that you can use the graphing tools to help you approximate the line.

Answers: 1
Another question on Mathematics
Mathematics, 21.06.2019 19:00
The ratio of the measures of the three angles in a triangle is 2: 9: 4. find the measures of the angels
Answers: 2
Mathematics, 21.06.2019 20:30
Write the summation to estimate the area under the curve y = 1 + x2 from x = -1 to x = 2 using 3 rectangles and right endpoints
Answers: 1
Mathematics, 21.06.2019 21:30
Write 5(6x+4)-2(5x-2) in the form a(bx+c) where a,b and c integers and a> 1
Answers: 1
Mathematics, 21.06.2019 21:30
In triangle △abc, ∠abc=90°, bh is an altitude. find the missing lengths. ah=4 and hc=1, find bh.
Answers: 2
You know the right answer?
The scatter plot shows the average monthly temperature, X, and a family's monthly heating cost, y, f...
Questions

Arts, 16.12.2020 19:50

English, 16.12.2020 19:50


Biology, 16.12.2020 19:50

Spanish, 16.12.2020 19:50

Social Studies, 16.12.2020 19:50
Social Studies, 16.12.2020 19:50
History, 16.12.2020 19:50
History, 16.12.2020 19:50

Chemistry, 16.12.2020 19:50


