
Mathematics, 21.05.2020 06:00 tommybear989
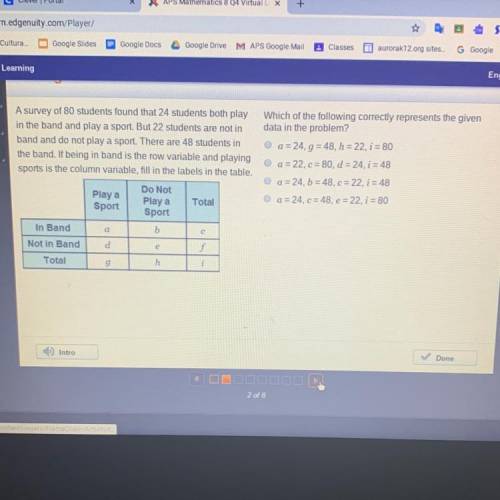
A survey of 80 students found that 24 students both play in the band and play a sport But 22 students are not in band and do not play a sport. There are 48 students in the band, if being in band is the row variable and playing sports is the column variable, fill in the labels in the table
Which of the following correctly represents the giver
data in the problem?
a=24.9=48, h=22, i = 80
a=22,c=80, d = 24, 1 = 48
a=24, b=48,e=22, i = 48
a=24.c= 48, e=22, i = 80

Answers: 1
Another question on Mathematics
Mathematics, 21.06.2019 17:20
Asap describe the transformations required to obtain the graph of the function f(x) from the graph of the function g(x). f(x)=-5.8sin x. g(x)=sin x. a: vertical stretch by a factor of 5.8, reflection across y-axis. b: vertical stretch by a factor of 5.8,reflection across x-axis. c: horizontal stretch by a factor of 5.8, reflection across x-axis. d: horizontal stretch by a factor of 5.8 reflection across y-axis.
Answers: 1
Mathematics, 21.06.2019 22:40
Aclassmate thinks that solving a system by graphing gives an exact answer when the lines appear to cross at a grid point, but only an approximate answer when they don't. explain why this isn't true.
Answers: 3
Mathematics, 22.06.2019 02:30
The upcoming championship high school football game is a big deal in your little town. the problem is, it is being played in the next biggest town, which is two hours away! to get as many people as you can to attend the game, you decide to come up with a ride-sharing app, but you want to be sure it will be used before you put all the time in to creating it. you determine that if more than three students share a ride, on average, you will create the app. you conduct simple random sampling of 20 students in a school with a population of 300 students to determine how many students are in each ride-share (carpool) on the way to school every day to get a good idea of who would use the app. the following data are collected: 6 5 5 5 3 2 3 6 2 2 5 4 3 3 4 2 5 3 4 5 construct a 95% confidence interval for the mean number of students who share a ride to school, and interpret the results. part a: state the parameter and check the conditions. part b: construct the confidence interval. be sure to show all your work, including the degrees of freedom, critical value, sample statistics, and an explanation of your process. part c: interpret the meaning of the confidence interval. part d: use your findings to explain whether you should develop the ride-share app for the football game.
Answers: 3
You know the right answer?
A survey of 80 students found that 24 students both play in the band and play a sport But 22 student...
Questions
Mathematics, 08.04.2020 04:21

English, 08.04.2020 04:21

History, 08.04.2020 04:21


Geography, 08.04.2020 04:21

Mathematics, 08.04.2020 04:21
History, 08.04.2020 04:21
Mathematics, 08.04.2020 04:21


