The graph below shows a company's profit f(x), in dollars, depending on the price of
erasers x...

Mathematics, 20.05.2020 15:57 Kadancepiggott7
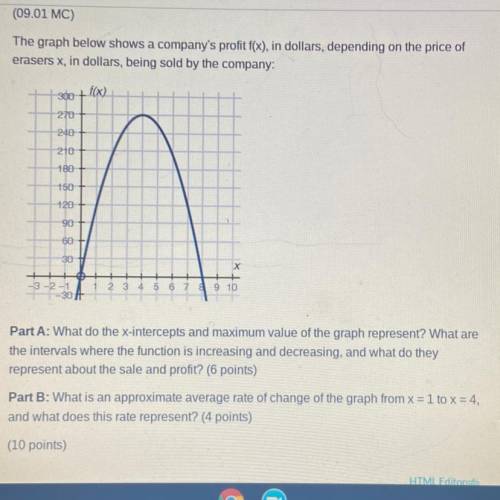
The graph below shows a company's profit f(x), in dollars, depending on the price of
erasers x, in dollars, being sold by the company:
30+ f(x)
270
NO
210
180
150
120
X
910
Part A: What do the x-intercepts and maximum value of the graph represent? What are
the intervals where the function is increasing and decreasing, and what do they
represent about the sale and profit? (6 points)
Part B: What is an approximate average rate of change of the graph from x = 1 to x = 4,
and what does this rate represent? (4 points)
Plz help

Answers: 1
Another question on Mathematics
Mathematics, 21.06.2019 22:50
Aweekly newspaper charges $72 for each inch in length and one column width. what is the cost of an ad that runs 2 column inches long and 2 columns wide? its not 288
Answers: 1
Mathematics, 22.06.2019 00:10
What 8/12+8/11 in another way than and improper fraction
Answers: 2
Mathematics, 22.06.2019 00:30
Find the area of just the wood portion of the frame. this is called a composite figure. you will need to use your values from problem #2need all exepct 4 answerd if you can
Answers: 1
Mathematics, 22.06.2019 02:30
In july, the average temperature in one us city was 29°c. by december, the average temperature had fallen by 29°c. explain why the average temperature in december was 0°c.
Answers: 3
You know the right answer?
Questions

Mathematics, 08.01.2020 06:31

Mathematics, 08.01.2020 06:31
History, 08.01.2020 06:31

Mathematics, 08.01.2020 06:31
Mathematics, 08.01.2020 06:31
Mathematics, 08.01.2020 06:31


World Languages, 08.01.2020 06:31
Mathematics, 08.01.2020 06:31


