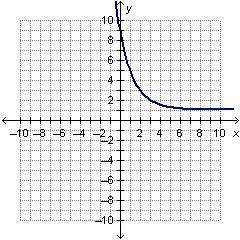
Which function is shown in the graph below?
A. y = (one-half) Superscript x + 3 Baseline...

Mathematics, 22.05.2020 07:03 tatermadison
Which function is shown in the graph below?
A. y = (one-half) Superscript x + 3 Baseline minus 1
B. y = (one-half) Superscript x minus 3 Baseline + 1
C. y = (one-half) Superscript x minus 1 Baseline + 3
D. y = (one-half) Superscript x + 1 Baseline minus 3

Answers: 1
Another question on Mathematics
Mathematics, 21.06.2019 18:10
which of the following sets of data would produce the largest value for an independent-measures t statistic? the two sample means are 10 and 20 with variances of 20 and 25 the two sample means are 10 and 20 with variances of 120 and 125 the two sample means are 10 and 12 with sample variances of 20 and 25 the two sample means are 10 and 12 with variances of 120 and 125
Answers: 2
Mathematics, 22.06.2019 03:30
Adie is rolled, what is the probability of getting an even number or a 3? write the solution too
Answers: 1
You know the right answer?
Questions


History, 18.03.2022 01:00
Mathematics, 18.03.2022 01:00
Mathematics, 18.03.2022 01:00


Mathematics, 18.03.2022 01:00
History, 18.03.2022 01:00

Geography, 18.03.2022 01:00


English, 18.03.2022 01:00
Mathematics, 18.03.2022 01:00


