The graph shows the cost to rent a surfboard for different amounts of time.
Cost to Rent a Sur...

Mathematics, 22.05.2020 07:03 coltbergstrom
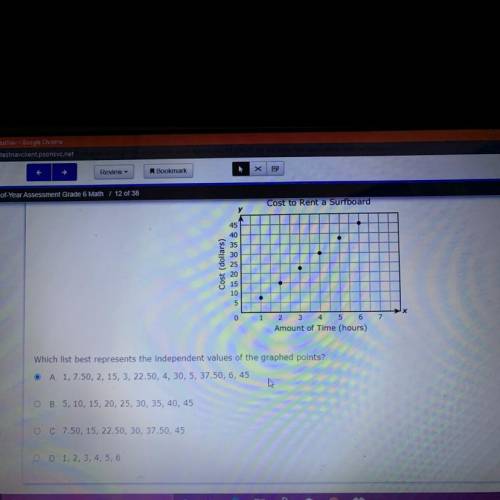
The graph shows the cost to rent a surfboard for different amounts of time.
Cost to Rent a Surfboard
Cost (dollars)
45
40
35
30
25
20
15
10
5
.
1 2 3
6
Amount of Time (hours)
Cost to Rent a surfboard. Cost in dollars. Amount of
Which list best represents the independent values of the graphed points?

Answers: 3
Another question on Mathematics
Mathematics, 21.06.2019 19:30
Powerful women's group has claimed that men and women differ in attitudes about sexual discrimination. a group of 50 men (group 1) and 40 women (group 2) were asked if they thought sexual discrimination is a problem in the united states. of those sampled, 11 of the men and 19 of the women did believe that sexual discrimination is a problem. if the p-value turns out to be 0.035 (which is not the real value in this data set), then at = 0.05, you should fail to reject h0. at = 0.04, you should reject h0. at = 0.03, you should reject h0. none of these would be a correct statement.
Answers: 2
Mathematics, 21.06.2019 23:00
The distance between two points is 6.5cm and scale of map is 1: 1000 what's the distance between the two points
Answers: 1
Mathematics, 22.06.2019 00:00
The graph shows the decibel measure for sounds depending on how many times as intense they are as the threshold of sound. noise in a quiet room is 500 times as intense as the threshold of sound. what is the decibel measurement for the quiet room? 20 decibels28 decibels200 decibels280 decibels
Answers: 1
You know the right answer?
Questions
Mathematics, 30.06.2020 02:01
SAT, 30.06.2020 02:01

Mathematics, 30.06.2020 02:01


Mathematics, 30.06.2020 02:01

History, 30.06.2020 02:01
Mathematics, 30.06.2020 02:01
Mathematics, 30.06.2020 02:01


History, 30.06.2020 02:01
Health, 30.06.2020 02:01


