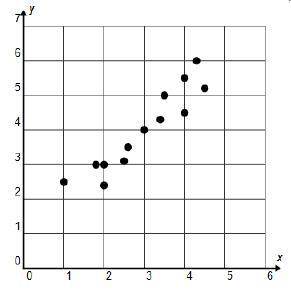
Which describes the correlation shown in the scatterplot?
On a graph, points are grouped...

Mathematics, 22.05.2020 16:59 lukeperry
Which describes the correlation shown in the scatterplot?
On a graph, points are grouped closely together and increase.
There is a positive correlation in the data set.
There is a negative correlation in the data set.
There is no correlation in the data set.
More points are needed to determine the correlation.

Answers: 1
Another question on Mathematics
Mathematics, 21.06.2019 13:00
225/100 of last years cost. write each fraction as a decimal and as a percent
Answers: 1
Mathematics, 21.06.2019 23:00
The length of an intercepted arc of a central angle of a circle is 4 cm. if the radius of the circle is 5 cm what is the measurement of the central angle to the nearest whole degree
Answers: 2
Mathematics, 21.06.2019 23:30
In a right triangle δabc, the length of leg ac = 5 ft and the hypotenuse ab = 13 ft. find: b the length of the angle bisector of angle ∠a.
Answers: 1
You know the right answer?
Questions

Mathematics, 08.11.2019 20:31


Social Studies, 08.11.2019 20:31


Mathematics, 08.11.2019 20:31

Mathematics, 08.11.2019 20:31
English, 08.11.2019 20:31


