
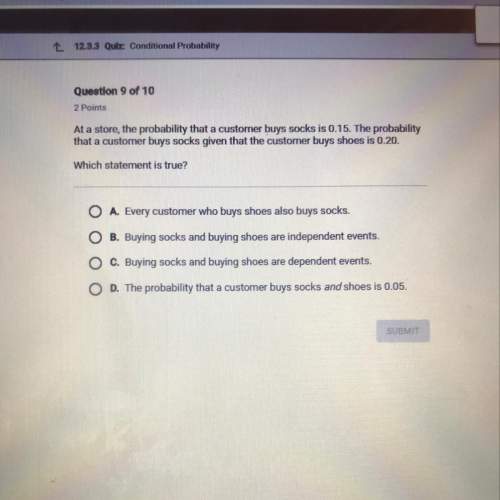
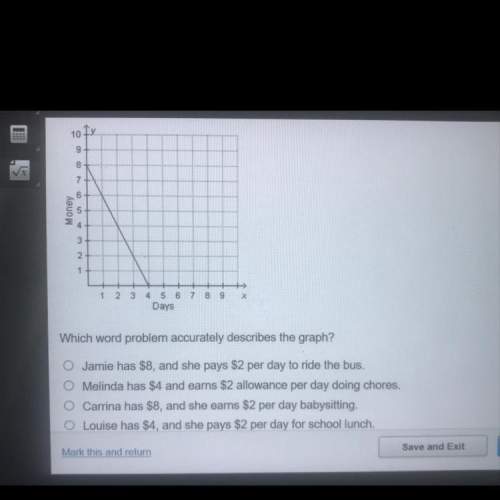
Mathematics, 22.05.2020 19:07 apere655
The results of a survey asking 500 people about their favorite ice cream flavor are shown in the table.
Find the experimental probability of each outcome in the sample space. Enter your answers in the boxes.
Flavor
Number of
People
90
125
Chocolate
Vanilla
Strawberry
Mint Chip
Other
60
50
175
%
%
P(chocolate) =
P(vanilla) =
P(strawberry) =
P(mint chip) =
P(other) =
%
%
9%

Answers: 1
Another question on Mathematics
Mathematics, 21.06.2019 16:00
If there is no real number solution to the quadratic equation x^2+2x+c=0 what is a possible value of c? 1 -2 0 3
Answers: 2
Mathematics, 21.06.2019 18:00
Identify which functions are linear or non-linear. a. f(x) = x2 + 1 b. f(x) = 2x + 5 c. f(x) = x 2 + 3 d. f(x) = 3 x + 7 e. f(x) = 4x + 10 2 - 5
Answers: 1
Mathematics, 21.06.2019 18:00
Suppose you are going to graph the data in the table. minutes temperature (°c) 0 -2 1 1 2 3 3 4 4 5 5 -4 6 2 7 -3 what data should be represented on each axis, and what should the axis increments be? x-axis: minutes in increments of 1; y-axis: temperature in increments of 5 x-axis: temperature in increments of 5; y-axis: minutes in increments of 1 x-axis: minutes in increments of 1; y-axis: temperature in increments of 1 x-axis: temperature in increments of 1; y-axis: minutes in increments of 5
Answers: 2
You know the right answer?
The results of a survey asking 500 people about their favorite ice cream flavor are shown in the tab...
Questions
Mathematics, 17.05.2021 16:50


Mathematics, 17.05.2021 16:50


Mathematics, 17.05.2021 16:50
Chemistry, 17.05.2021 16:50

Advanced Placement (AP), 17.05.2021 16:50
Mathematics, 17.05.2021 16:50
English, 17.05.2021 16:50
History, 17.05.2021 16:50
Mathematics, 17.05.2021 16:50


