
Mathematics, 22.05.2020 00:03 Xapper14x
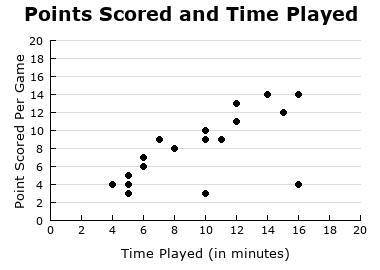
The scatter plot shows the amount of time Oscar played and the number of points he scored during each basketball game. Which describes the association of the variables in the data?
A)
no association
B)
nonlinear association
C)
positive, linear association
D)
negative, linear association

Answers: 1
Another question on Mathematics
Mathematics, 21.06.2019 17:20
Which system of linear inequalities is represented by the graph? + l tv x-3y > 6 and y > 2x o x + 3y > 6 and y o x-3y > 6 and y> 2x o x + 3y > 6 and y > 2x + 4 la +
Answers: 1
Mathematics, 21.06.2019 22:30
At the beginning of year 1, carlos invests $600 at an annual compound interest rate of 4%. he makes no deposits to or withdrawals from the account. which explicit formula can be used to find the account's balance at the beginning of year 5? what is, the balance?
Answers: 2
Mathematics, 22.06.2019 02:00
Milk and ice cream are mixed together for a recipe. the total volume of the mixture is 1 cup. if the milk contains 2% fat, the cream contains 18% fat ,and the mixture contains 6% fat ,how much cream is in the mixture
Answers: 1
You know the right answer?
The scatter plot shows the amount of time Oscar played and the number of points he scored during eac...
Questions

Social Studies, 29.07.2019 11:30
Mathematics, 29.07.2019 11:30

History, 29.07.2019 11:30

Mathematics, 29.07.2019 11:30
Mathematics, 29.07.2019 11:30
Mathematics, 29.07.2019 11:30
Mathematics, 29.07.2019 11:30

History, 29.07.2019 11:30


