25 points and please help quick
Doug records how many miles and how long he rides his bik...

Mathematics, 23.05.2020 21:00 epicriderexe
25 points and please help quick
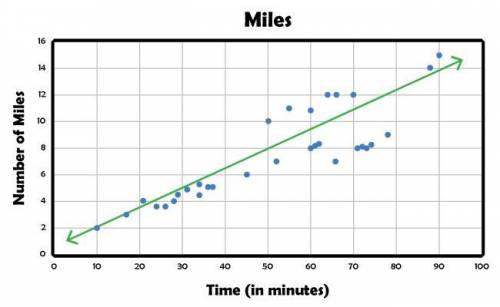
Doug records how many miles and how long he rides his bike each day on a scatter plot.
Doug analyzes his data on the scatter plot and concludes that the more time he rides his bike, the slower his speed is. In two or more complete sentences, explain why or why not it is possible for Doug to make his conclusion based on his data.

Answers: 1
Another question on Mathematics
Mathematics, 21.06.2019 16:00
Part one: measurements 1. measure your own height and arm span (from finger-tip to finger-tip) in inches. you will likely need some from a parent, guardian, or sibling to get accurate measurements. record your measurements on the "data record" document. use the "data record" to you complete part two of this project. name relationship to student x height in inches y arm span in inches archie dad 72 72 ginelle mom 65 66 sarah sister 64 65 meleah sister 66 3/4 67 rachel sister 53 1/2 53 emily auntie 66 1/2 66 hannah myself 66 1/2 69 part two: representation of data with plots 1. using graphing software of your choice, create a scatter plot of your data. predict the line of best fit, and sketch it on your graph. part three: the line of best fit include your scatter plot and the answers to the following questions in your word processing document 1. 1. which variable did you plot on the x-axis, and which variable did you plot on the y-axis? explain why you assigned the variables in that way. 2. write the equation of the line of best fit using the slope-intercept formula $y = mx + b$. show all your work, including the points used to determine the slope and how the equation was determined. 3. what does the slope of the line represent within the context of your graph? what does the y-intercept represent? 5. use the line of best fit to you to describe the data correlation.
Answers: 2
Mathematics, 21.06.2019 16:50
Suppose that the price p (in dollars) and the weekly sales x (in thousands of units) of a certain commodity satisfy the demand equation 4p cubedplusx squaredequals38 comma 400. determine the rate at which sales are changing at a time when xequals80, pequals20, and the price is falling at the rate of $.20 per week.
Answers: 3
Mathematics, 21.06.2019 18:00
Describe the relationship between the angles of similar triangles and the sides of similar triangles
Answers: 1
You know the right answer?
Questions

Social Studies, 16.07.2019 23:30


Business, 16.07.2019 23:30

Physics, 16.07.2019 23:30
Physics, 16.07.2019 23:30
Mathematics, 16.07.2019 23:30

Biology, 16.07.2019 23:30
Social Studies, 16.07.2019 23:30
Mathematics, 16.07.2019 23:30
History, 16.07.2019 23:30
History, 16.07.2019 23:30
Business, 16.07.2019 23:30


