Data collected on the discharge of the Colorado River and speed are given in the table:
...

Mathematics, 23.05.2020 13:57 avelyp
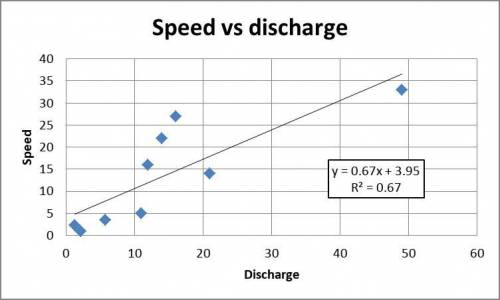
Data collected on the discharge of the Colorado River and speed are given in the table:
Discharge (ft3) Speed
1.3 2.3
2.2 0.99
5.8 3.5
11 5
12 16
14 22
16 27
21 14
49 33
Find r2, and interpret the results. (4 points)
Group of answer choices
0.67; The least-squares regression line, given by ŷ = 3.95 + 0.82x, is a good fit for the data.
0.82; The least-squares regression line, given by ŷ = 3.95 + 0.82x, is not a good fit to the data.
0.82; The least-squares regression line, given by ŷ = 0.82 + 3.95x, is a good fit for the data.
0.67; The least-squares regression line, given by ŷ = 3.95 + 0.67x, is not a good fit for the data.

Answers: 2
Another question on Mathematics
Mathematics, 21.06.2019 14:30
The amount of money, in dollars, in an account after t years is given by a = 1000(1.03)^t. the initial deposit into the account was $_^a0 and the interest rate was _a1% per year. only enter numbers in the boxes. do not include any commas or decimal points^t. the initial deposit into the account was $__^a0 and the interest rate is % per year.
Answers: 1
Mathematics, 21.06.2019 20:00
Given the two similar triangles, how do i find the missing length? if a=4, b=5, and b'=7.5 find a'
Answers: 1
Mathematics, 21.06.2019 21:30
The box plots show the average speeds, in miles per hour, for the race cars in two different races. which correctly describes the consistency of the speeds of the cars in the two races?
Answers: 3
You know the right answer?
Questions


English, 23.09.2021 18:50
Mathematics, 23.09.2021 18:50

Mathematics, 23.09.2021 18:50
Mathematics, 23.09.2021 18:50
Mathematics, 23.09.2021 18:50


Computers and Technology, 23.09.2021 18:50
Biology, 23.09.2021 18:50
Chemistry, 23.09.2021 18:50

Social Studies, 23.09.2021 18:50


