
Mathematics, 24.05.2020 01:58 aiueo6692
A manager is assessing the correlation between the number of employees in a plant and the number of products produced yearly. The table shows the data:
Number of employees
(x) 0 25 50 75 100 125 150 175 200
Number of products
(y) 10 160 310 460 610 760 910 1060 1210
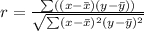
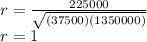
Part A: Is there any correlation between the number of employees in the plant and the number of products produced yearly? Justify your answer. (4 points)
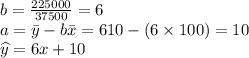
Part B: Write a function that best fits the data. (3 points)
Part C: What does the slope and y-intercept of the plot indicate? (3 points)

Answers: 3


Another question on Mathematics
Mathematics, 21.06.2019 18:10
Find the value of p for which the polynomial 3x^3 -x^2 + px +1 is exactly divisible by x-1, hence factorise the polynomial
Answers: 2
Mathematics, 21.06.2019 19:00
What are the solutions of the system? solve by graphing. y = x^2 + 3x + 2 y = 2x + 2
Answers: 1
Mathematics, 22.06.2019 04:00
Which expression equals 9^3 sqrt 10 a. 5 sqrt 10 + 4 sqrt 10 b. 5^3 sqrt 10 + 4 ^3 sqrt 10 c. 5 sqrt 10 + 4^3 sqrt 10 d. 5^3 sqrt 10 + 4 sqrt 10
Answers: 1
Mathematics, 22.06.2019 05:00
Q= {1.7, 1.1, 1.4, 2.1, 2.3, s}. what is the absolute difference between the greatest and least possible values of the median of set q? express your answer as a decimal to the nearest hundredth.
Answers: 3
You know the right answer?
A manager is assessing the correlation between the number of employees in a plant and the number of...
Questions

Biology, 25.05.2020 00:00

History, 25.05.2020 00:00

English, 25.05.2020 00:00
Mathematics, 25.05.2020 00:00
History, 25.05.2020 00:00

History, 25.05.2020 00:00


