
Mathematics, 24.05.2020 05:58 KayleighMorganhopkin
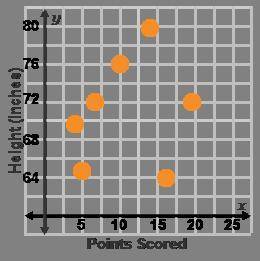
Trent collected data from his basketball team to analyze points scored in a game according to players’ heights. He created this scatterplot.
A graph has points scored on the x-axis and height (inches) on the y-axis.
Analyze Trent’s scatterplot to identify the error he made when creating the scatterplot.
His variables should be games and points.
He needs to connect the points to create a line.
He switched the input and output; height should be on the x-axis.
His points show no relationship, which is not possible using bivariate data.

Answers: 2
Another question on Mathematics
Mathematics, 21.06.2019 19:30
Which inequality has a dashed boundary line when graphed ?
Answers: 2
Mathematics, 21.06.2019 19:30
Which describes the difference between the graph of f(x)=x^2 and g(x)=-(x^2-2)
Answers: 1
Mathematics, 21.06.2019 23:20
For which pairs of functions is (f•g)(x)=12x? f(x)=3-4x and g(x)=16x-3 f(x)=6x2 and g(x)= 2/x f(x)= and g(x) = 144x f(x)=4x and g(x) =3x
Answers: 1
You know the right answer?
Trent collected data from his basketball team to analyze points scored in a game according to player...
Questions

Mathematics, 19.11.2021 21:40


Chemistry, 19.11.2021 21:40


Chemistry, 19.11.2021 21:40
Mathematics, 19.11.2021 21:40

Chemistry, 19.11.2021 21:40


