Statistics MATH 2000 50490 Summer 2020 Section 07 Asynchronous
DeTrese Bowen & 05/24/20 2:...

Mathematics, 25.05.2020 22:58 Becky323
Statistics MATH 2000 50490 Summer 2020 Section 07 Asynchronous
DeTrese Bowen & 05/24/20 2:39
Homework: UNITI - Section 3.2 - Measures of Variation
Score: 0 of 1 pt
8 of 14 (9 complete)
HW Score: 54.85%, 768 of
3.2.37
Question Help
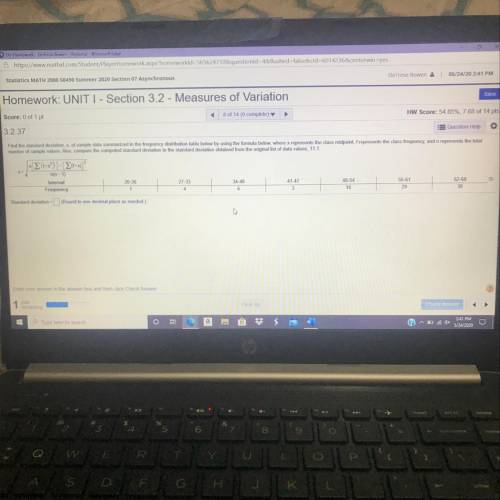
Find the standard deviation of sample data summarized in the frequency distribution table below by using the formula below where x represents the class midpoint, represents the class frequency, and in represents the total
number of sample values. Also, compare the computed standard deviation to the standard deviation obtained from the original list of data values, 11.1

Answers: 2
Another question on Mathematics
Mathematics, 21.06.2019 15:30
The average hourly earnings for a construction worker is projected to be $24.50 in 2012. jason wants to join the construction work force after he graduates in 2012. his friend tells him that average hourly earnings for construction workers will rise by 2% from 2009 to 2012. based on the data below, assuming that the projected hourly earnings are correct, is jason’s friend’s statement accurate? construction industry - average hourly earnings, 2000-2009 a. his friend’s statement is accurate. the average hourly earnings will increase by 2%. b. his friend’s statement is not accurate. the percent increase will be more than 2% c. his friend’s statement is not accurate. the percent increase will be less than 2% d. his friend’s statement is not accurate. the average hourly earnings will decrease
Answers: 3
Mathematics, 21.06.2019 16:30
When only separate discreet points are graphed it is called?
Answers: 3
Mathematics, 21.06.2019 17:30
What is the multiple zero and multiplicity of f(x) = (x ? 3)(x ? 3)(x + 5)? multiple zero is 3; multiplicity is 2 multiple zero is 5; multiplicity is 1 multiple zero is ? 5; multiplicity is 1 multiple zero is ? 3; multiplicity is 2
Answers: 2
Mathematics, 21.06.2019 21:30
The box plots show the average speeds, in miles per hour, for the race cars in two different races. which correctly describes the consistency of the speeds of the cars in the two races?
Answers: 3
You know the right answer?
Questions


Mathematics, 06.04.2021 03:20


Social Studies, 06.04.2021 03:20


Mathematics, 06.04.2021 03:20
Mathematics, 06.04.2021 03:20
Mathematics, 06.04.2021 03:20


