Use the interactive number line to graph the inequality x > –2.5.
Which statements ar...

Mathematics, 27.05.2020 23:59 shradhwaip2426
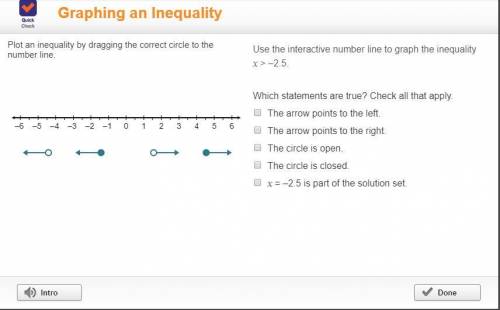
Use the interactive number line to graph the inequality x > –2.5.
Which statements are true? Check all that apply.
The arrow points to the left.
The arrow points to the right.
The circle is open.
The circle is closed.
x = –2.5 is part of the solution set.

Answers: 3
Another question on Mathematics
Mathematics, 21.06.2019 16:00
Which term best describes the association between variables a and b? no association a negative linear association a positive linear association a nonlinear association a scatterplot with an x axis labeled, variable a from zero to ten in increments of two and the y axis labeled, variable b from zero to one hundred forty in increments of twenty with fifteen points in a positive trend.
Answers: 2
Mathematics, 21.06.2019 18:30
Find the area of the regular hexagon if a side is 20 cm.
Answers: 2
Mathematics, 21.06.2019 19:30
Michelle and julie work at a catering company. they need to bake 264 cookies for a birthday party that starts in a little over an hour and a half. each tube of cookie dough claims to make 36 cookies, but michelle eats about 1/5 of every tube and julie makes cookies that are 1.5 times as large as the recommended cookie size.it takes about 8 minutes to bake a container of cookies, but since julie's cookies are larger, they take 12 minutes to bake. a. how many tubes should each girl plan to bake? how long does each girl use the oven? b. explain your solution process what did you make? c. what assumptions did you make?
Answers: 1
Mathematics, 22.06.2019 01:30
Acell phone company offers two plans to its subscribers. at the time new subscribers sign up, they are asked to provide some demographic information. the mean yearly income for a sample of 40 subscribers to plan a is $45,000 with a standard deviation of $9,200. for a sample of 25 subscribers to plan b, the mean income is $64,300 with a standard deviation of $7,100. at the 0.025 significance level, is it reasonable to conclude the mean income of those selecting plan b is larger? assume unequal population standard deviations. hint: for the calculations, assume the plan a as the first sample. what is the decision rule? (negative amount should be indicated by a minus sign. round your answer to 3 decimal places.) compute the value of the test statistic. (negative amount should be indicated by a minus sign. round your answer to 2 decimal places.) what is your decision regarding h0 ? reject h0 fail to reject h0 compute the p-value. less than 0.01 between 0.01 and 0.025 between 0.025 and 0.05 between 0.05 and 0.10 greater than 0.10
Answers: 3
You know the right answer?
Questions

Arts, 26.10.2019 10:43

History, 26.10.2019 10:43

Mathematics, 26.10.2019 10:43
Mathematics, 26.10.2019 10:43

Mathematics, 26.10.2019 10:43
Mathematics, 26.10.2019 10:43
History, 26.10.2019 10:43

Physics, 26.10.2019 10:43
Mathematics, 26.10.2019 10:43


