
Mathematics, 02.06.2020 02:57 Queenhagar
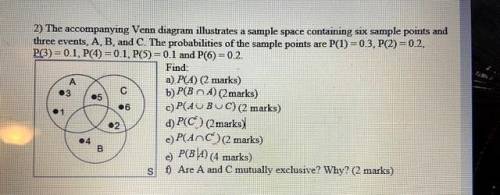
The accompanying Venn diagram illustrates a sample space containing six sample points and three events, A, B, and C. The probabilities of the sample points are P(1) = 0.3, P(2) = 0.2, P(3) = 0.1, P(4) = 0.1, P(5) = 0.1 and P(6) = 0.2.
Find:

Answers: 3
 . This set has no points in it, so its probability is 0.
 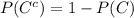 . P(C) is the probability by summing 5,6,2 so P(C) = 0.5. So
 That is, all the points that are in A but not in C. So add 1,3. Then the probability is 0.4
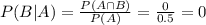 , using the definition of conditional probabily and results a,b.
  is the probability of 5, that is 0.1. Since 0.1>0, they are not mutually exclusive.
Another question on Mathematics
Mathematics, 21.06.2019 18:00
Adj has a total of 1075 dance and rock songs on her system. the dance selection is 4 times the size of the rock selection. write a system of equations to represent the situation.
Answers: 1
Mathematics, 21.06.2019 21:30
Hannah paid $3.20 for 16 ounces of potato chips. hank paid $3.23 for 17 ounces of potato chips. who paid less per ounces?
Answers: 1
Mathematics, 21.06.2019 21:30
Ten members of balin's soccer team ran warm ups for practice. each member ran the same distance. their combined distance was 5/6 of a mile. to find the distance that each member ran, balin wrote the expression below.
Answers: 3
Mathematics, 21.06.2019 23:00
What is the sum of the first 8 terms of the geometric series
Answers: 3
You know the right answer?
The accompanying Venn diagram illustrates a sample space containing six sample points and three even...
Questions

Mathematics, 17.12.2020 04:20
Mathematics, 17.12.2020 04:20

Mathematics, 17.12.2020 04:20
History, 17.12.2020 04:20

Biology, 17.12.2020 04:20
History, 17.12.2020 04:20
History, 17.12.2020 04:20

Spanish, 17.12.2020 04:20


English, 17.12.2020 04:20

Chemistry, 17.12.2020 04:20


