

These box plots show daily low temperatures for a sample of days in two
different towns
Town...

Mathematics, 06.06.2020 19:57 hanz73
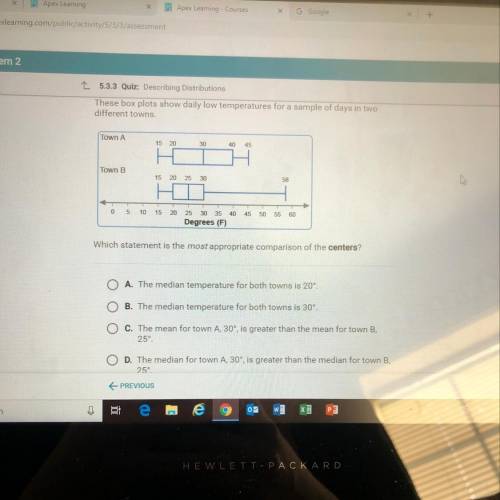
These box plots show daily low temperatures for a sample of days in two
different towns
Town A
15 20
30
40
45
Town B
15
20
25
30
58
O
5
10
15
20
45
50
55
60
25 30 35 40
Degrees (F)
Which statement is the most appropriate comparison of the centers?
O A. The median temperature for both towns is 20'
OB. The median temperature for both towns is 30%,
O c. The mean for town A, 30°, is greater than the mean for town B,
25
OD. The median for town A, 30, is greater than the median for town B.
25
PREVIOUS

Answers: 3
Another question on Mathematics
Mathematics, 21.06.2019 19:00
What are the solutions of the system? y = x^2 + 2x +3y = 4x - 2a. (-1, -6) and (-3, -14)b. (-1, 10) and (3, -6)c. no solutiond. (-1, -6) and (3, 10)
Answers: 1
Mathematics, 21.06.2019 22:00
Manuela claims that and are congruent. which statement best describes her claim? she is incorrect because the segments do not have the same orientation. she is incorrect because the segments do not have the same length. she is correct because the segments have the same length. she is correct because the segments have the same orientation.
Answers: 1
Mathematics, 22.06.2019 00:00
(20 points) a bank has been receiving complaints from real estate agents that their customers have been waiting too long for mortgage confirmations. the bank prides itself on its mortgage application process and decides to investigate the claims. the bank manager takes a random sample of 20 customers whose mortgage applications have been processed in the last 6 months and finds the following wait times (in days): 5, 7, 22, 4, 12, 9, 9, 14, 3, 6, 5, 15, 10, 17, 12, 10, 9, 4, 10, 13 assume that the random variable x measures the number of days a customer waits for mortgage processing at this bank, and assume that x is normally distributed. 2a. find the sample mean of this data (x ě…). 2b. find the sample variance of x. find the variance of x ě…. for (c), (d), and (e), use the appropriate t-distribution 2c. find the 90% confidence interval for the population mean (îľ). 2d. test the hypothesis that îľ is equal to 7 at the 95% confidence level. (should you do a one-tailed or two-tailed test here? ) 2e. what is the approximate p-value of this hypothesis?
Answers: 2
You know the right answer?
Questions

Physics, 17.02.2021 21:00


History, 17.02.2021 21:00
Mathematics, 17.02.2021 21:00
History, 17.02.2021 21:00
History, 17.02.2021 21:00


History, 17.02.2021 21:00
Mathematics, 17.02.2021 21:00

Social Studies, 17.02.2021 21:00
Physics, 17.02.2021 21:00


