
Mathematics, 07.06.2020 00:04 liltweetypie08ovdod4
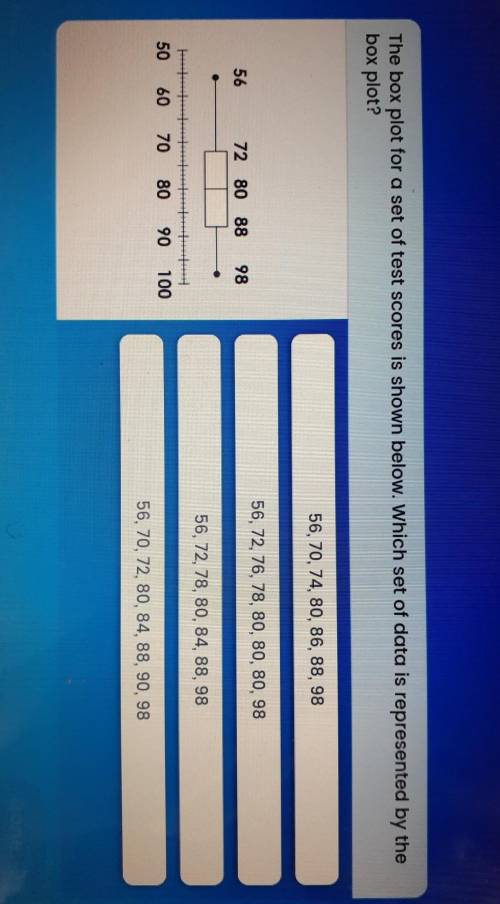
The box plot for a set of test scores is shown below. Which set of data is represented by the
box plot?
56, 70, 74, 80, 86, 88, 98
56, 72, 76, 78, 80, 80, 80, 98
56
72 80 88
98
56, 72, 78, 80, 84, 88, 98
50 60
70
80
90
100
56, 70, 72, 80, 84, 88, 90, 98

Answers: 3
Another question on Mathematics
Mathematics, 21.06.2019 23:00
Look at the chart showing the results of a baseball player at bat. which is the probability of getting a hit?
Answers: 1
Mathematics, 21.06.2019 23:00
Charlie tosses five coins.what is the probability that all five coins will land tails up.
Answers: 2
You know the right answer?
The box plot for a set of test scores is shown below. Which set of data is represented by the
box p...
Questions

Biology, 20.12.2021 01:00


Mathematics, 20.12.2021 01:00


Mathematics, 20.12.2021 01:00

Geography, 20.12.2021 01:00
Mathematics, 20.12.2021 01:00

Chemistry, 20.12.2021 01:00
History, 20.12.2021 01:00
Biology, 20.12.2021 01:00
Mathematics, 20.12.2021 01:00


