
Mathematics, 07.06.2020 04:58 jessicachichelnitsky
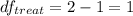
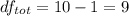
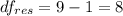
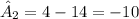
A researcher collected data on the hours of TV watched per day from a sample of five people of different ages. Here are the results:i Age TV Hrs 1 43 1 2 30 6 3 22 4 4 20 3 5 5 6 1. Calculate the least squares estimated regression equation using simple linear regression. 2. What is the independent variable in this study?a) {y}b) agec) tv hoursd) Ie) 53) Create an ANOVA table. Using α=.05.

Answers: 1
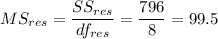
 = 24
= 24 = 4
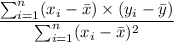
= 4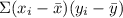 = -79
= -79 = 778
= 778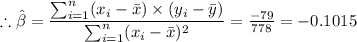


![\sum_{i}\SS_{row}_i = \sum_{i}\sum_{j} (y_{ij} - \bar y)= [(1 - 4)^2 + (6 - 4)^2 + (4 - 4)^2 + (3 - 4)^2 + (6 - 4)^2] = 18](/tpl/images/0679/3656/3ee0d.png)
![\sum_{i} S S_{row}_i = \sum_{i}\sum_{j} (y_{ij} - \bar y) ^2= [(43 - 24)^2 + (30 - 24)^2 + (22 - 24)^2 + (20 - 24)^2 + (5 - 24)^2] = 778](/tpl/images/0679/3656/1114b.png)

 = (43 - 14)² + (30 - 14)² + (22 - 14)² + (20 - 14)² + (5 - 14)² + (1 - 14)1² + (6 - 4
)² + (3 - 14)² + (6 - 14)² = 1796
= (43 - 14)² + (30 - 14)² + (22 - 14)² + (20 - 14)² + (5 - 14)² + (1 - 14)1² + (6 - 4
)² + (3 - 14)² + (6 - 14)² = 1796
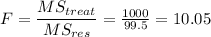
 , we reject the null hypothesis.
Another question on Mathematics
Mathematics, 21.06.2019 17:00
Which graph corresponds to the function f(x) = x2 + 4x – 1?
Answers: 1
Mathematics, 21.06.2019 19:30
The pyramid below was dissected by a horizontal plane which shape describes the pyramid horizontal cross section
Answers: 1
Mathematics, 21.06.2019 21:30
(c) the diagram shows the first three shapes of a matchsticks arrangement.first shape = 3second shape = 5third shape = 7given m represents the number of matchstick used to arrange the n'th shape.(i) write a formula to represent the relation between m and n. express m as the subjectof the formula.(ii) 19 matchsticks are used to make the p'th shape. find the value of p.
Answers: 2
Mathematics, 21.06.2019 23:50
Which function has the domain x> -11? y= x+ 11 +5 y= x-11 +5 y= x+5 - 11 y= x+5 + 11
Answers: 2
You know the right answer?
A researcher collected data on the hours of TV watched per day from a sample of five people of diffe...
Questions


Computers and Technology, 13.10.2019 04:50
English, 13.10.2019 04:50

Mathematics, 13.10.2019 04:50

History, 13.10.2019 04:50


Mathematics, 13.10.2019 04:50


Mathematics, 13.10.2019 04:50
English, 13.10.2019 04:50


