
Mathematics, 10.06.2020 23:57 haileydixon1816
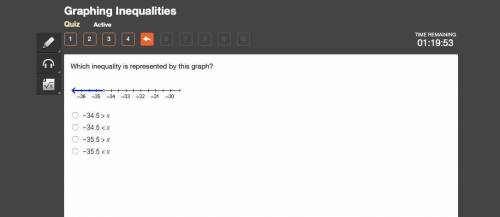
Which inequality is represented by this graph? A number line going from negative 36 to negative 30. An open circle is at negative 34.5. Everything to the left of the circle is shaded. Negative 34.5 greater-than x Negative 34.5 less-than x Negative 35.5 greater-than x Negative 35.5 less-than x

Answers: 3
Another question on Mathematics
Mathematics, 21.06.2019 12:30
What is the equation in point slope form of the line that passes through the point (-1, -3) and has a slope of 4? y-1=4(x-3) or y+3=4(x+1)
Answers: 2
Mathematics, 21.06.2019 15:00
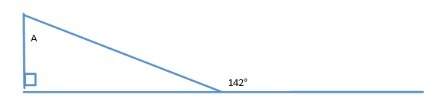
1. are the triangles similar and if so why? what is the value of x? show your work.
Answers: 1
Mathematics, 21.06.2019 17:00
You are a clerk at convenience store. a customer owes 11.69 for a bag of potatoes chips. she gives you a five dollar bill. how much change should the customer receive?
Answers: 2
You know the right answer?
Which inequality is represented by this graph? A number line going from negative 36 to negative 30....
Questions

Mathematics, 14.01.2021 20:20

Mathematics, 14.01.2021 20:20

Arts, 14.01.2021 20:20

History, 14.01.2021 20:20

History, 14.01.2021 20:20
Mathematics, 14.01.2021 20:20
Mathematics, 14.01.2021 20:20


