
Mathematics, 11.06.2020 23:57 alyssaflores
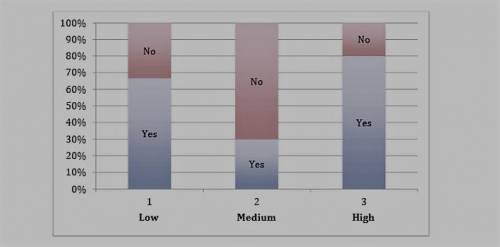
The following crosstabulation summarizes the data for two categorical variables, x and y. The variable x can take on values low, medium, or high and the variable y can take on values yes or no.
Y
X Yes No Total
Low 20 10 30
Medium 15 35 50
High 20 5 25
Total 55 50 105
1. Compute the row percentage
2. Construct a sketch percentage of frequency bar chat with x on horozontal axis.

Answers: 3
Another question on Mathematics
Mathematics, 21.06.2019 14:20
What is the point-slope form of the equation for the line with a slope of -2 that passes through (1,4)?
Answers: 1
Mathematics, 21.06.2019 16:00
Given right triangle xyz, which correctly describes the locations of the sides in relation to
Answers: 1
Mathematics, 21.06.2019 20:00
Mat bought a phone for $100. he has to pay $30 per mouth. if he has paid $640 in total, how many mouth has he had the phone?
Answers: 2
Mathematics, 21.06.2019 23:30
Robin spent 25% more time on his research project than he had planned he’s been an extra h ours on the project which of the following expressions could represent the number of hours rob actually spent on the project
Answers: 3
You know the right answer?
The following crosstabulation summarizes the data for two categorical variables, x and y. The variab...
Questions


Social Studies, 09.12.2021 01:00

Mathematics, 09.12.2021 01:00
Mathematics, 09.12.2021 01:00

Mathematics, 09.12.2021 01:00
Mathematics, 09.12.2021 01:00


