These dot plots show hourly earnings for a sample of workers in two
different careers.
Career...

Mathematics, 15.06.2020 22:57 teamsadie8426
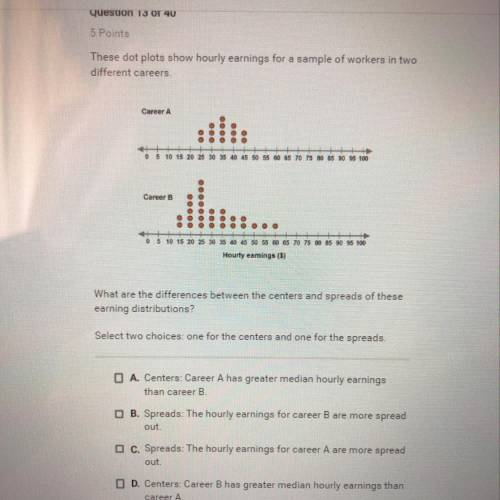
These dot plots show hourly earnings for a sample of workers in two
different careers.
Career A
0 5 10 15 20 25 30 35 40 45 50 55 60 65 70 75 80 85 90 95 100
Career B
0 5 10 15 20 25 30 35 40 45 50 55 60 65 70 75 80 85 90 95 100
Hourly eamings ($)
What are the differences between the centers and spreads of these
earning distributions?
Select two choices: one for the centers and one for the spreads.
O A. Centers: Career A has greater median hourly earnings
than career B.
B. Spreads: The hourly earnings for career B are more spread
out.
O c. Spreads: The hourly earnings for career A are more spread
out.
O D. Centers: Career B has greater median hourly earnings than
career A

Answers: 3
Another question on Mathematics
Mathematics, 22.06.2019 02:10
You use technology ans find a sum of 6.712e-8. write this sum in standard form
Answers: 1
Mathematics, 22.06.2019 02:30
Aline passes through the points (5,4) and (2.1). part a.) what is the slope of the line that passes through these points? show work. part b.) what is the equation of the line that passes through these points. show work. part c.) where does the line intercept on the x& y axis? show work
Answers: 1
You know the right answer?
Questions

Chemistry, 18.10.2020 01:01
Mathematics, 18.10.2020 01:01

Mathematics, 18.10.2020 01:01
Mathematics, 18.10.2020 01:01

Biology, 18.10.2020 01:01

Social Studies, 18.10.2020 01:01
Mathematics, 18.10.2020 01:01
English, 18.10.2020 01:01

Mathematics, 18.10.2020 01:01
Biology, 18.10.2020 01:01


