Mathematics, 16.06.2020 22:57 yourmumsanoodle
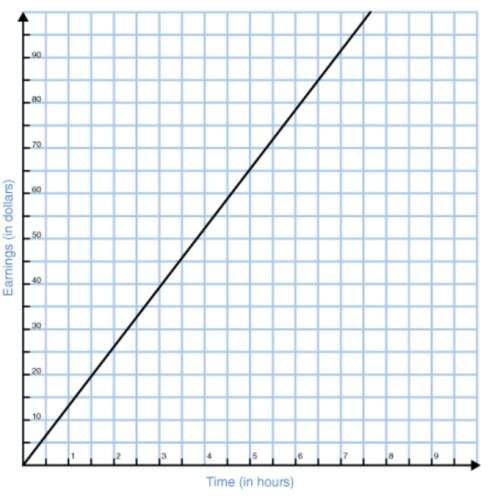
Which graph represents the solution to the compound inequality?

Answers: 2
Another question on Mathematics

Mathematics, 21.06.2019 15:10
The green family is a family of six people. they have used 4,885.78 gallons of water so far this month. they cannot exceed 9,750.05 gallons per month during drought season. write an inequality to show how much water just one member of the family can use for the remainder of the month, assuming each family member uses the same amount of water every month.
Answers: 1

Mathematics, 21.06.2019 16:10
In a sample of 200 residents of georgetown county, 120 reported they believed the county real estate taxes were too high. develop a 95 percent confidence interval for the proportion of residents who believe the tax rate is too high. (round your answers to 3 decimal places.) confidence interval for the proportion of residents is up to . would it be reasonable to conclude that the majority of the taxpayers feel that the taxes are too high?
Answers: 3

Mathematics, 21.06.2019 20:30
Cody was 165cm tall on the first day of school this year, which was 10% taller than he was on the first day of school last year.
Answers: 1

Mathematics, 21.06.2019 22:00
The table below lists recommended amounts of food to order for 10 party guests. how much of each food item should nathan and amanda order for a graduation party with 55 guests? use the table to answer. item amount fried chicken 16 pieces lasagna 7 pounds deli meats 1.8 pounds sliced cheese 1 and two fifths pounds bakery buns 1 dozen potato salad 2 pounds
Answers: 3
You know the right answer?
Which graph represents the solution to the compound inequality?...
Questions

History, 18.07.2019 03:30


French, 18.07.2019 03:30


Biology, 18.07.2019 03:30


History, 18.07.2019 03:30

Social Studies, 18.07.2019 03:30

History, 18.07.2019 03:30


History, 18.07.2019 03:30


History, 18.07.2019 03:30


Mathematics, 18.07.2019 03:30


English, 18.07.2019 03:30

Mathematics, 18.07.2019 03:30


